Modelling heat pump growth in Scotland
Making a case for strategic and localised transition plans to achieve net-zero homes


Regional differences in geography, housing stock and dominant heating fuel types mean that demand for low-carbon heating installations, now and in the years to come, will likely not be uniform across Scotland.
We have explored what the regional profiles for heat pump uptake may look like as they respond to the regulations and supply pipeline over the next 10 to 25 years.
First, let’s understand where heat pumps have been installed so far and why this differs across the country.
Scroll through the graphs to see highlighted details.

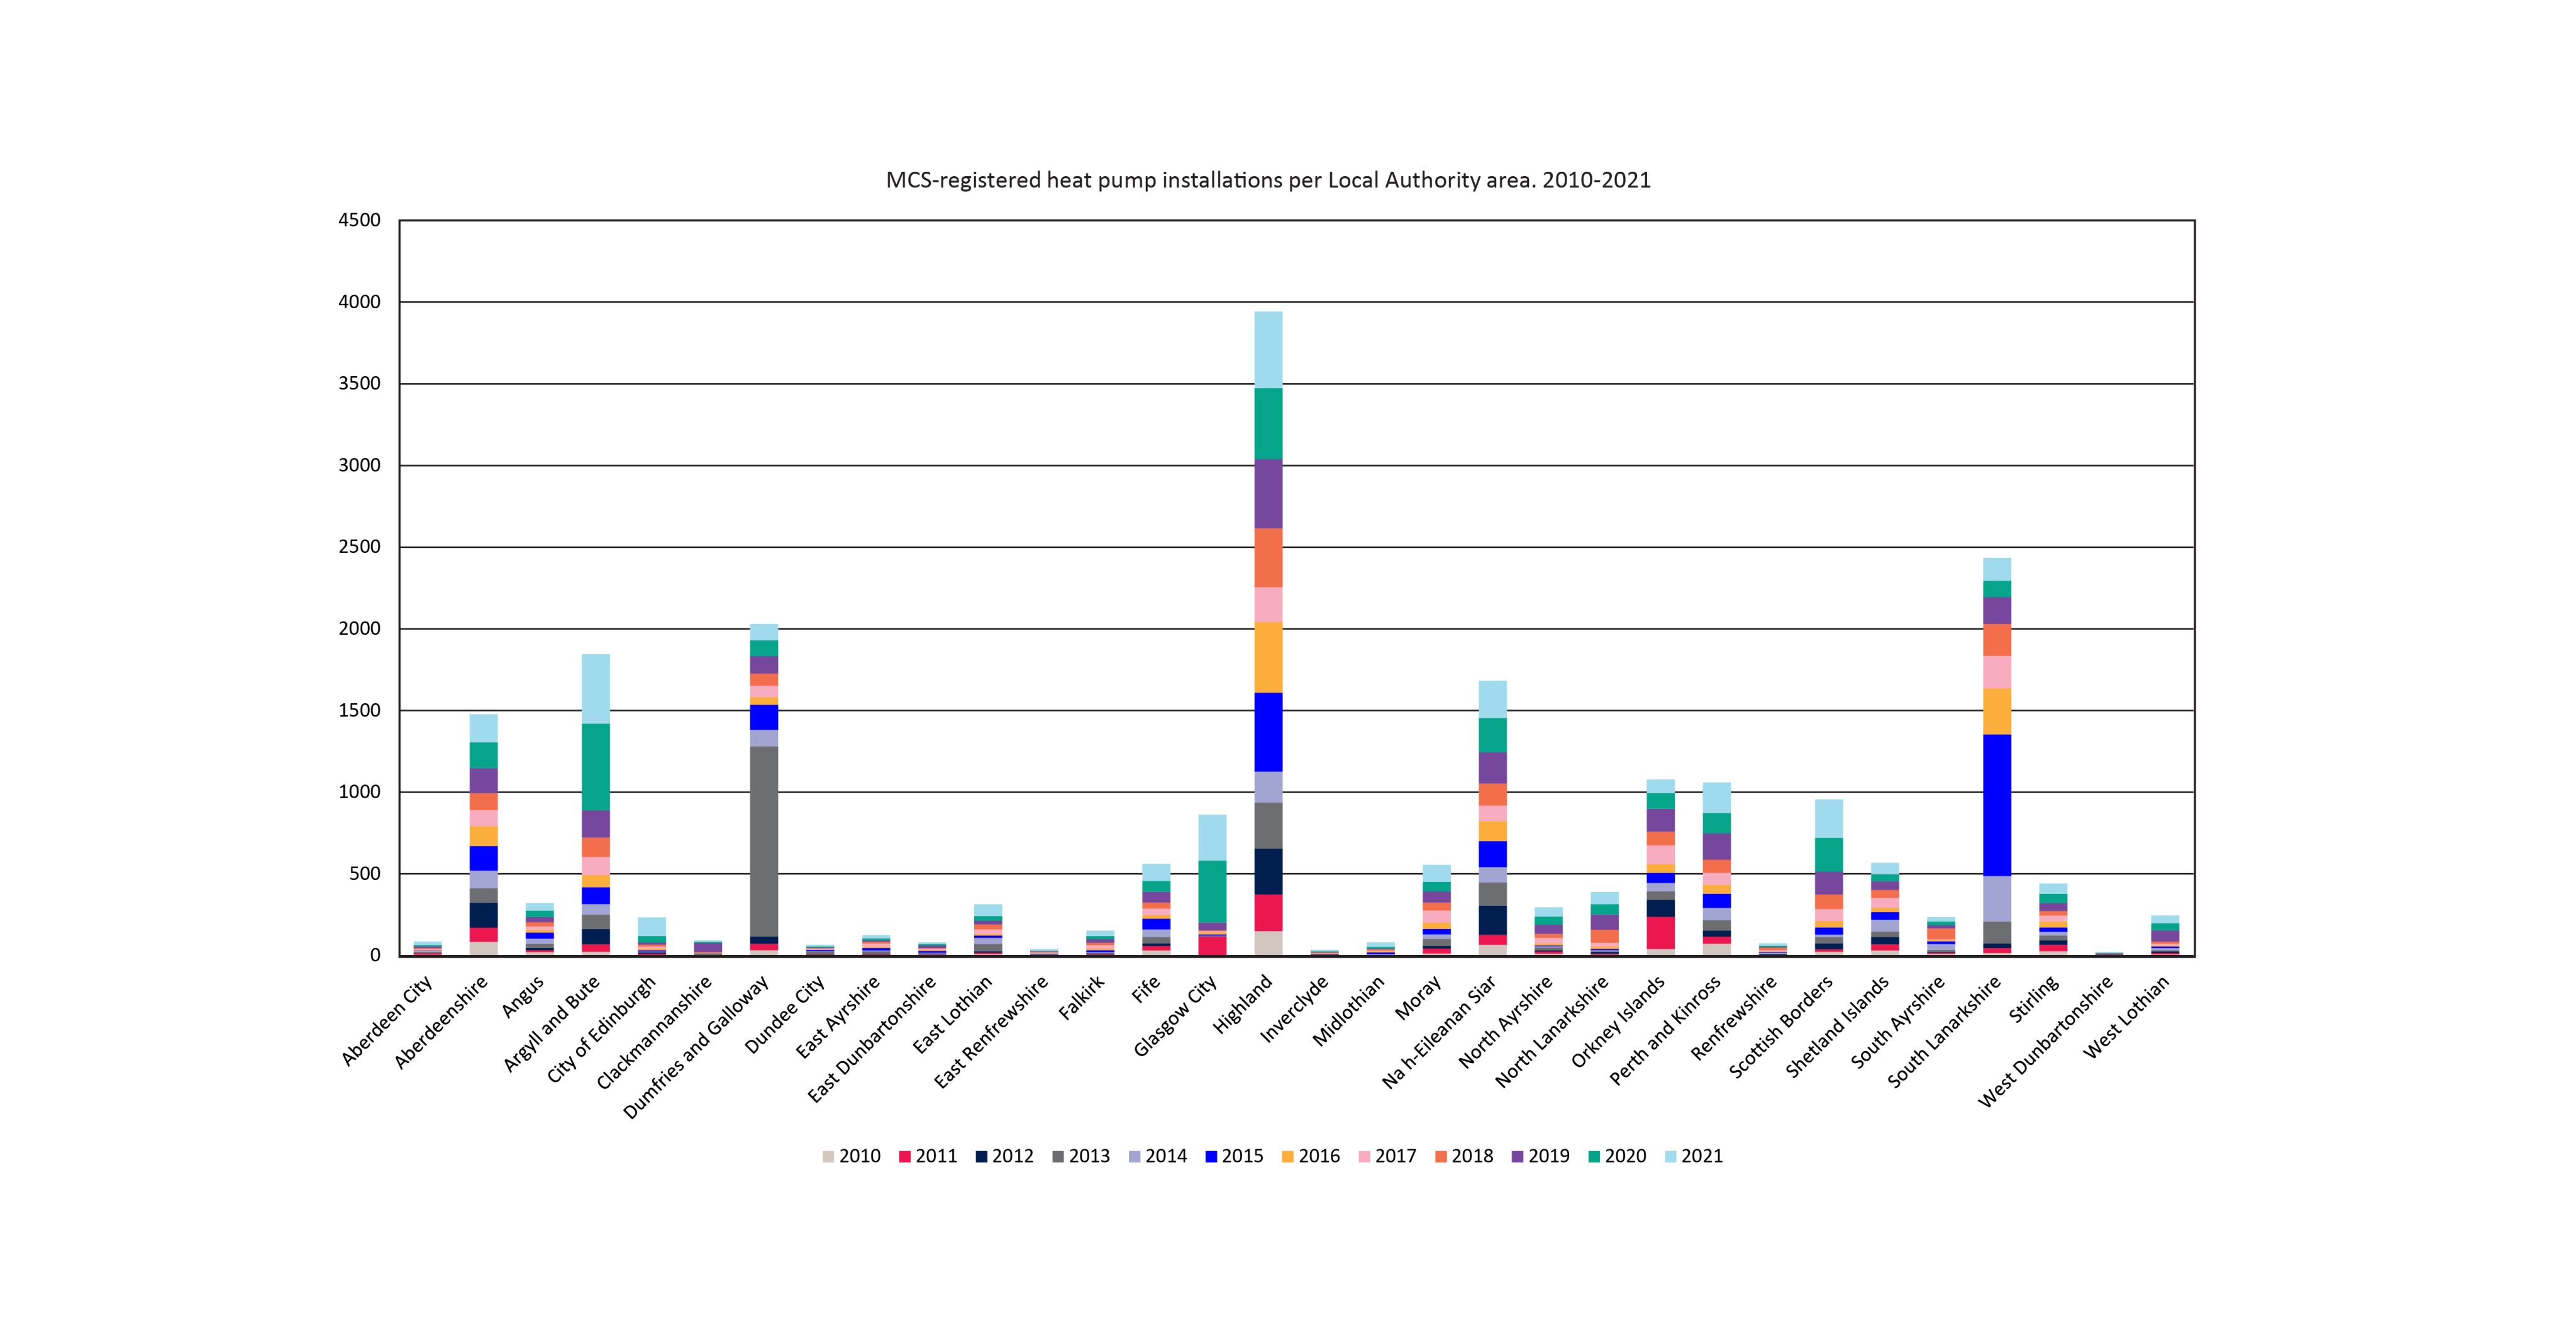

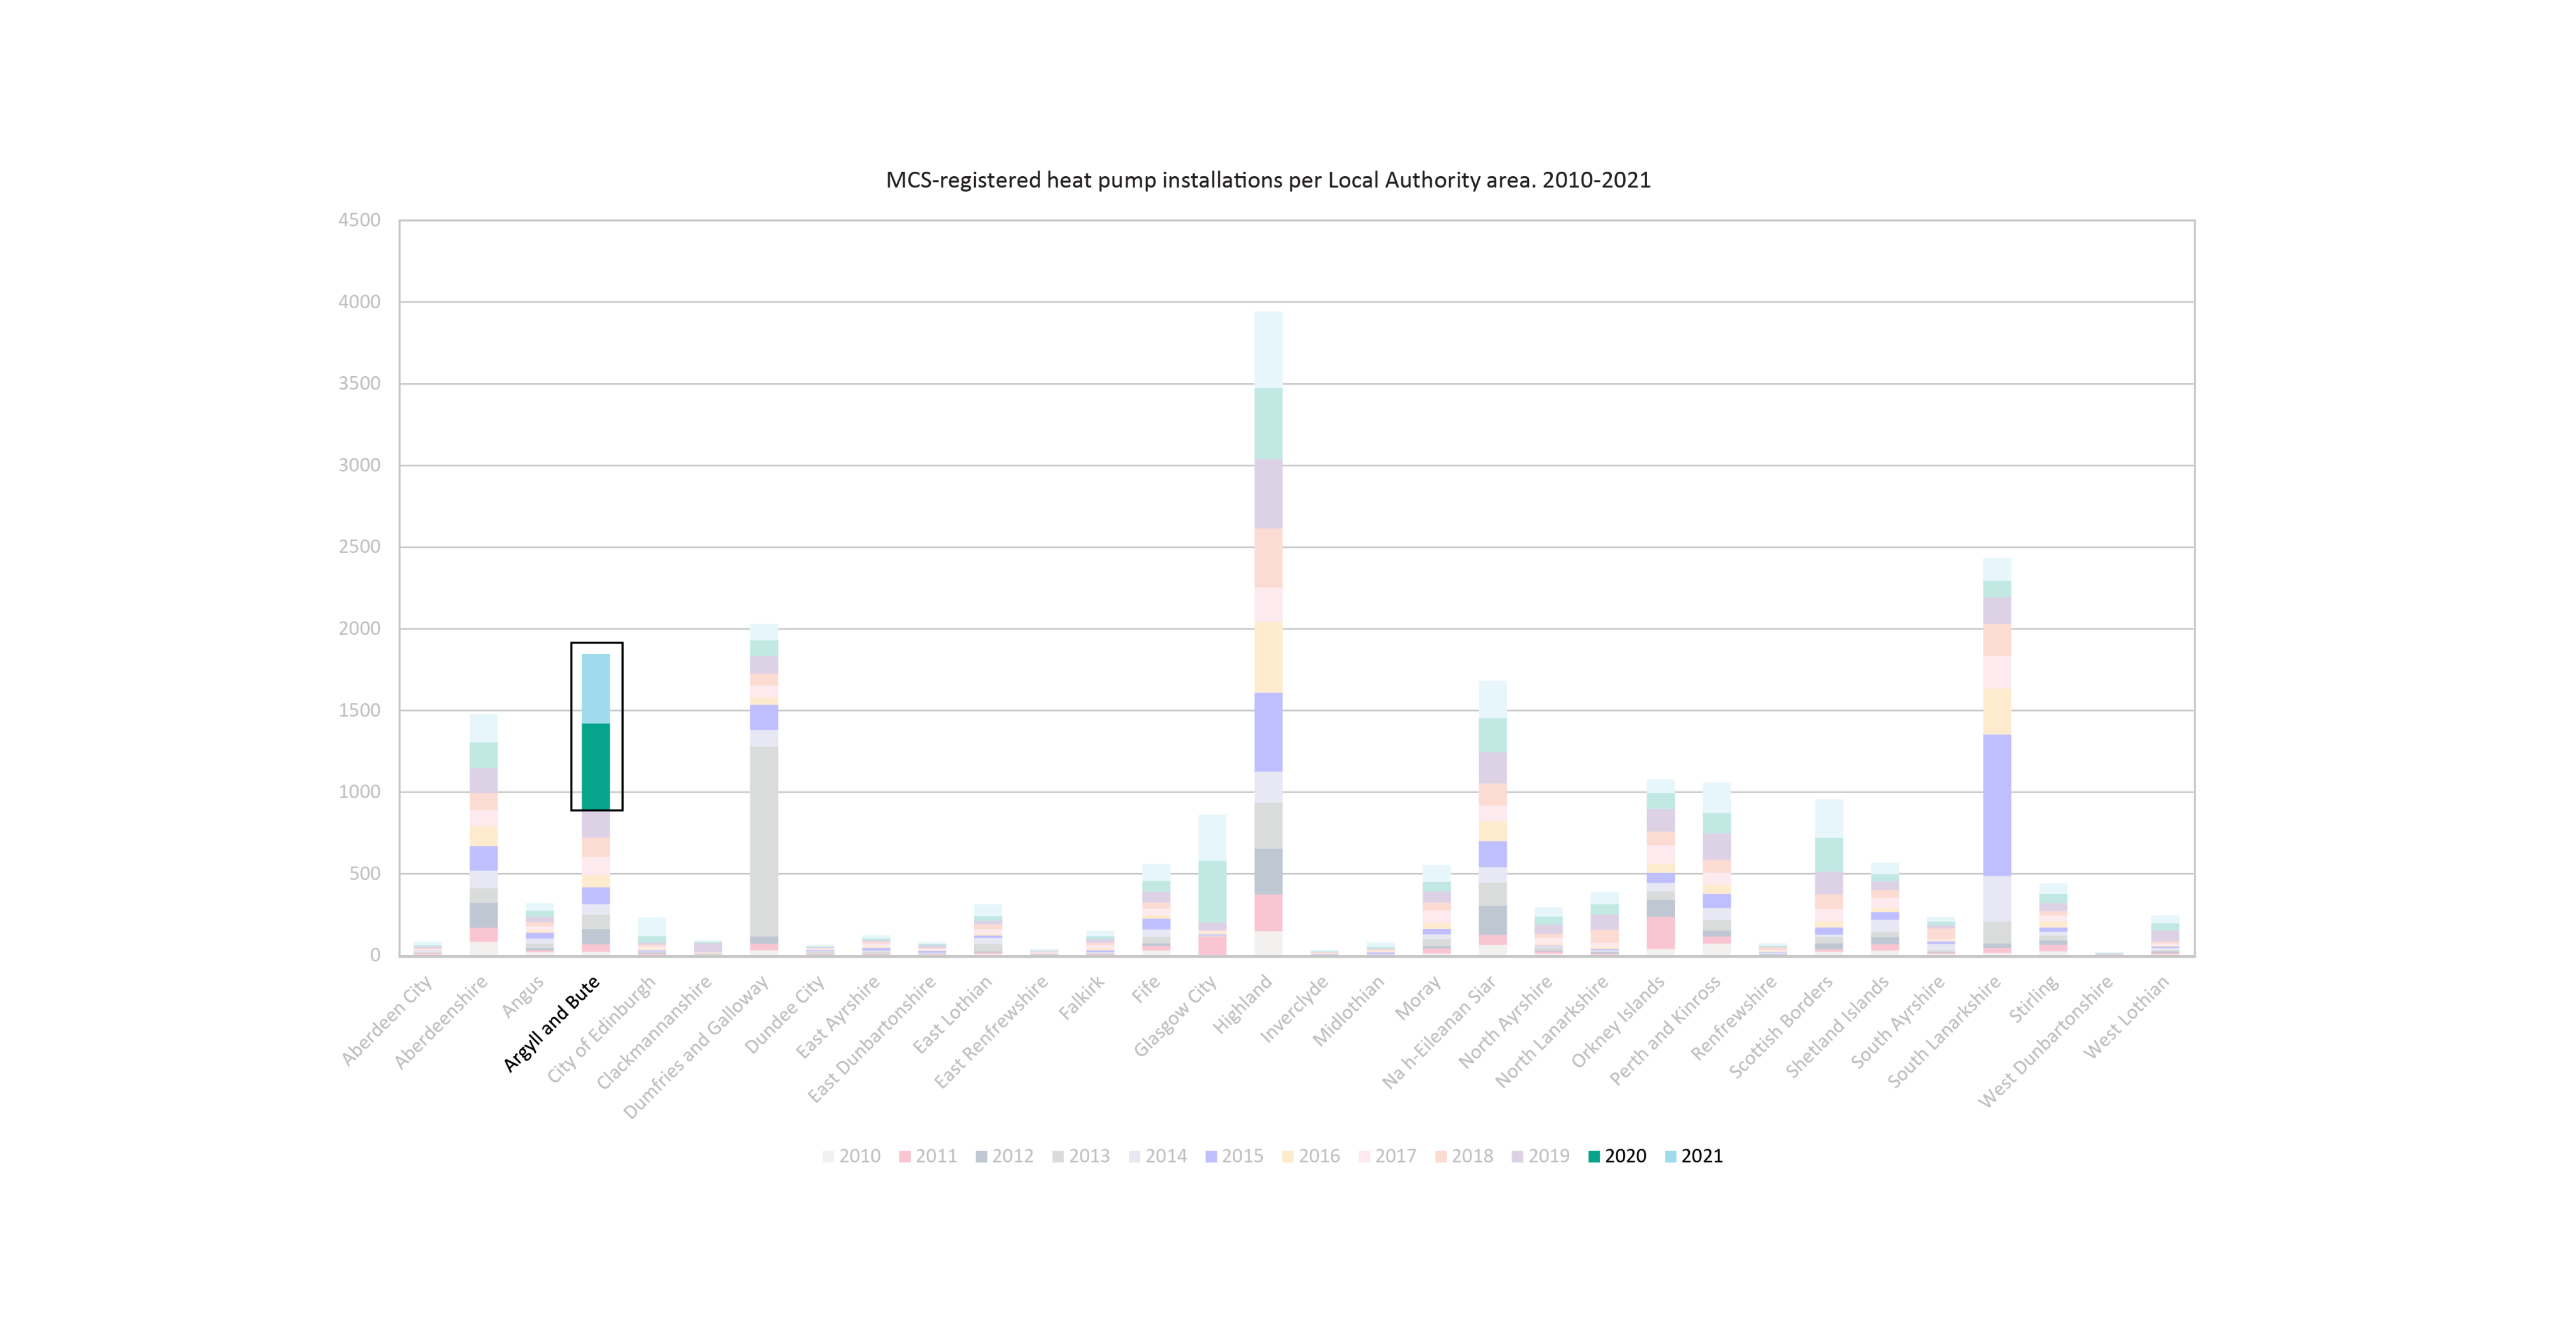


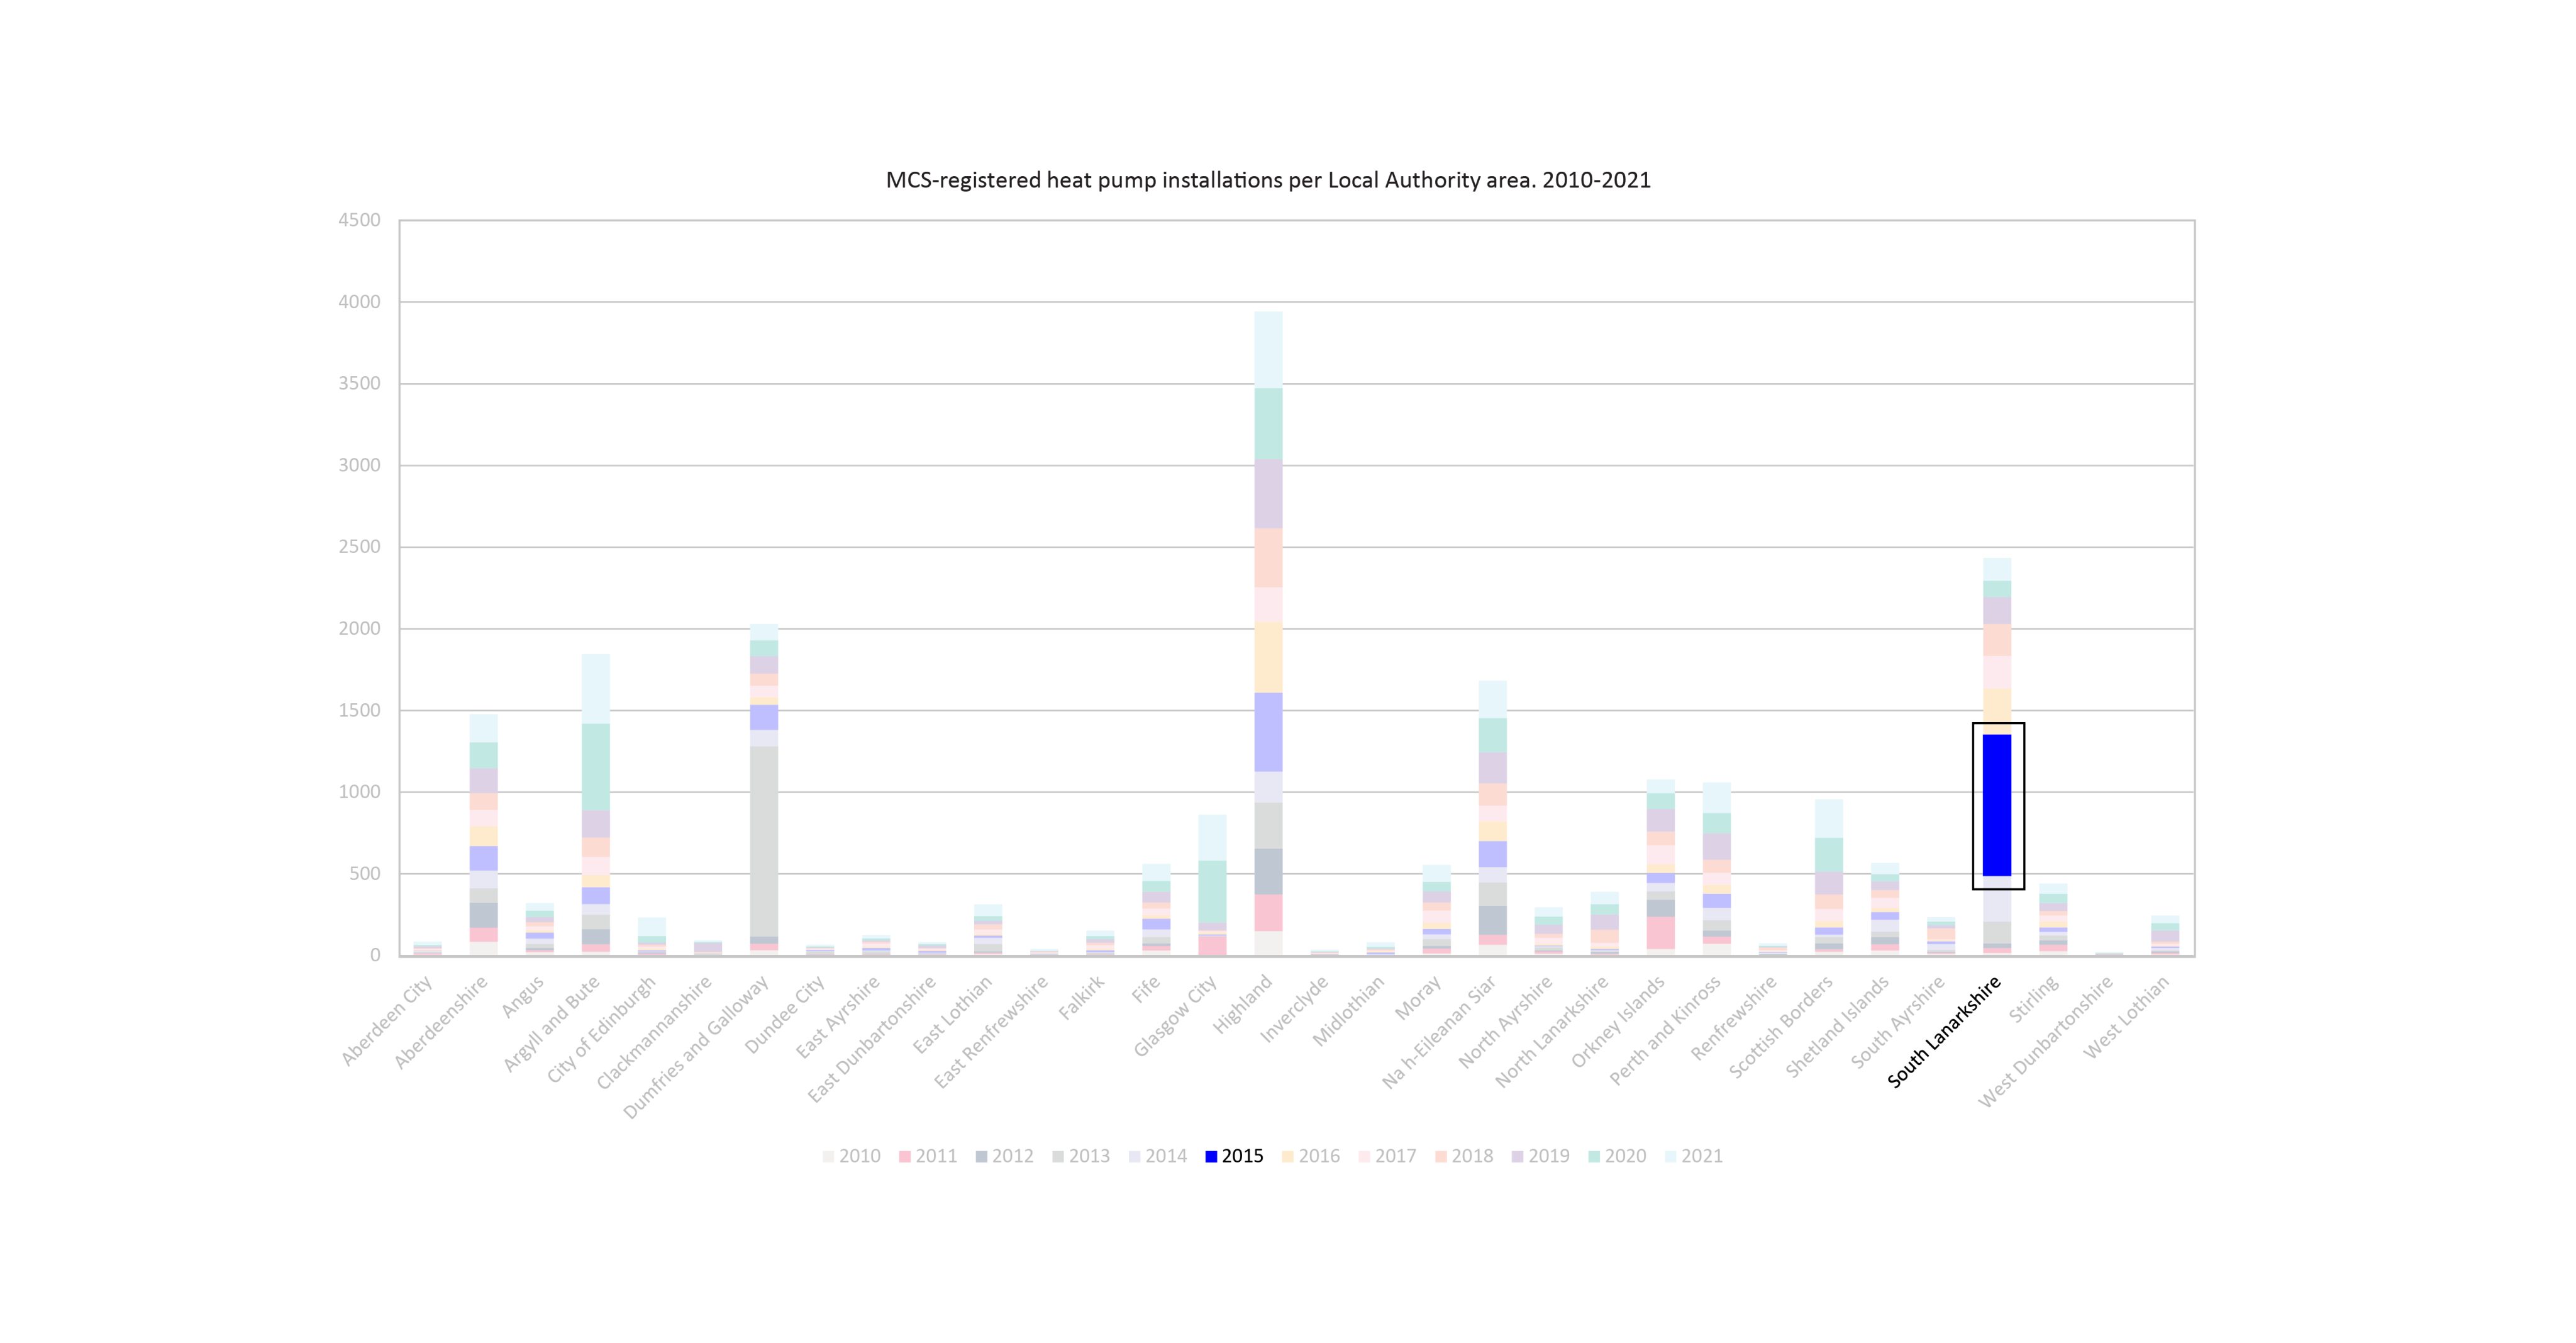
Argyll Community Housing Association targeted 845 homes in 2020-2021.
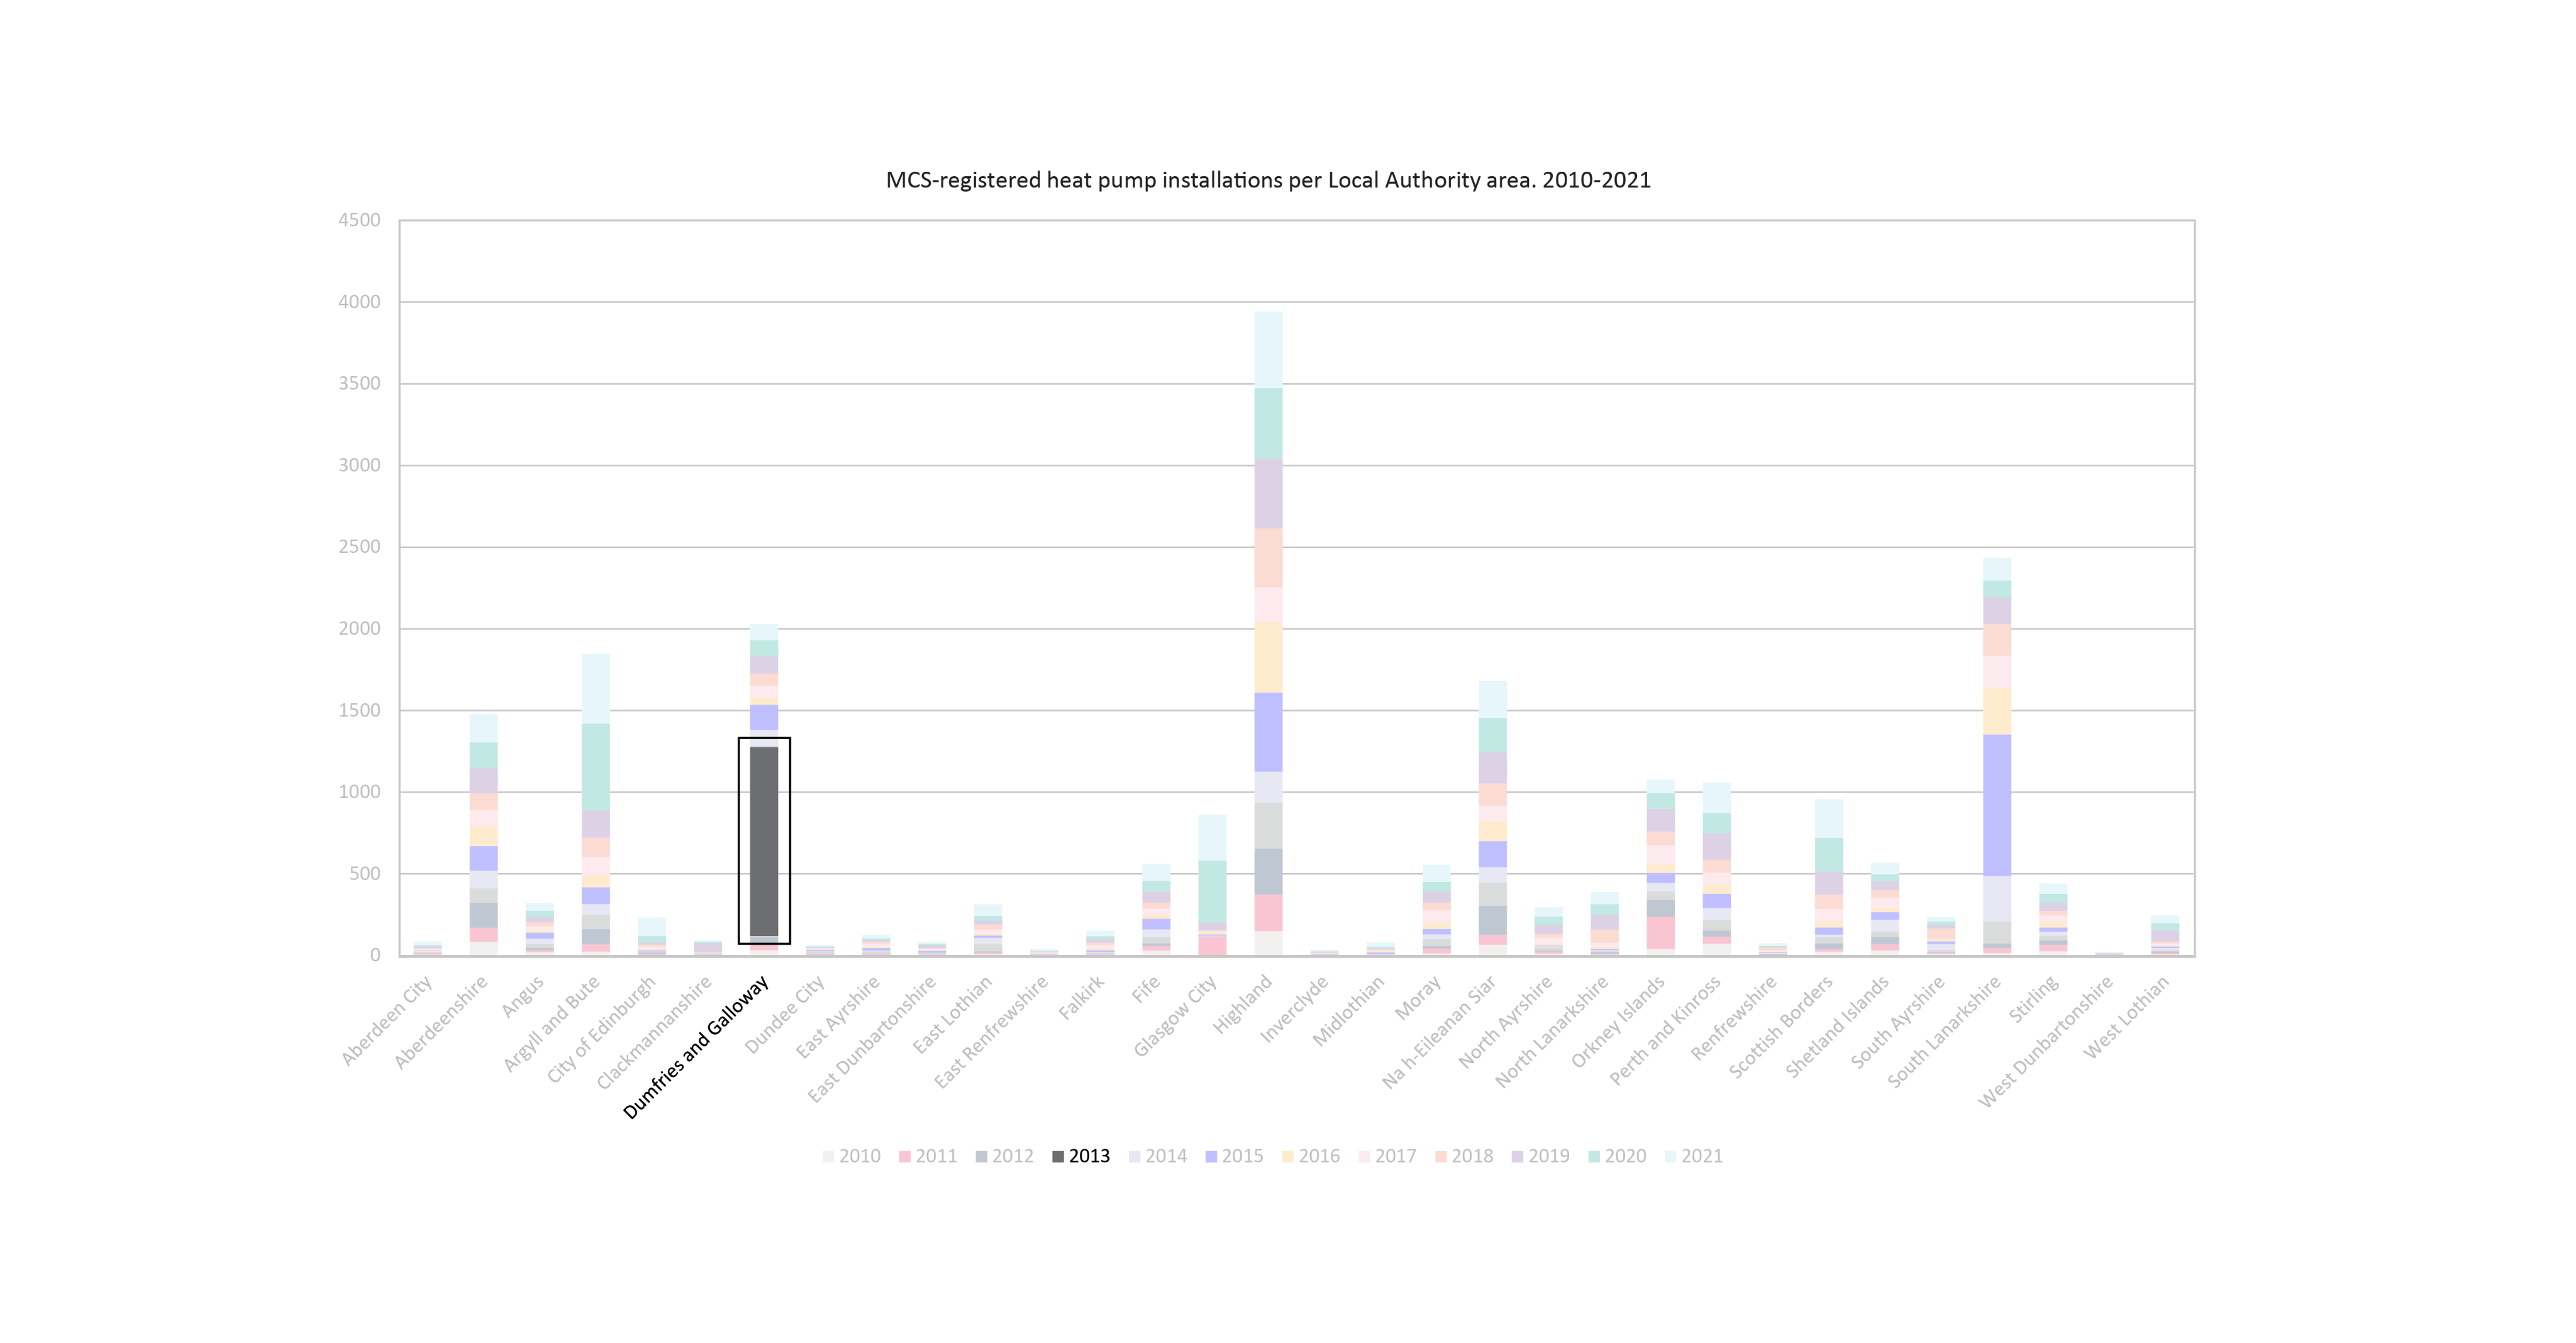
Dumfries and Galloway Housing Partnership installed 1,100 in 2011-2013.
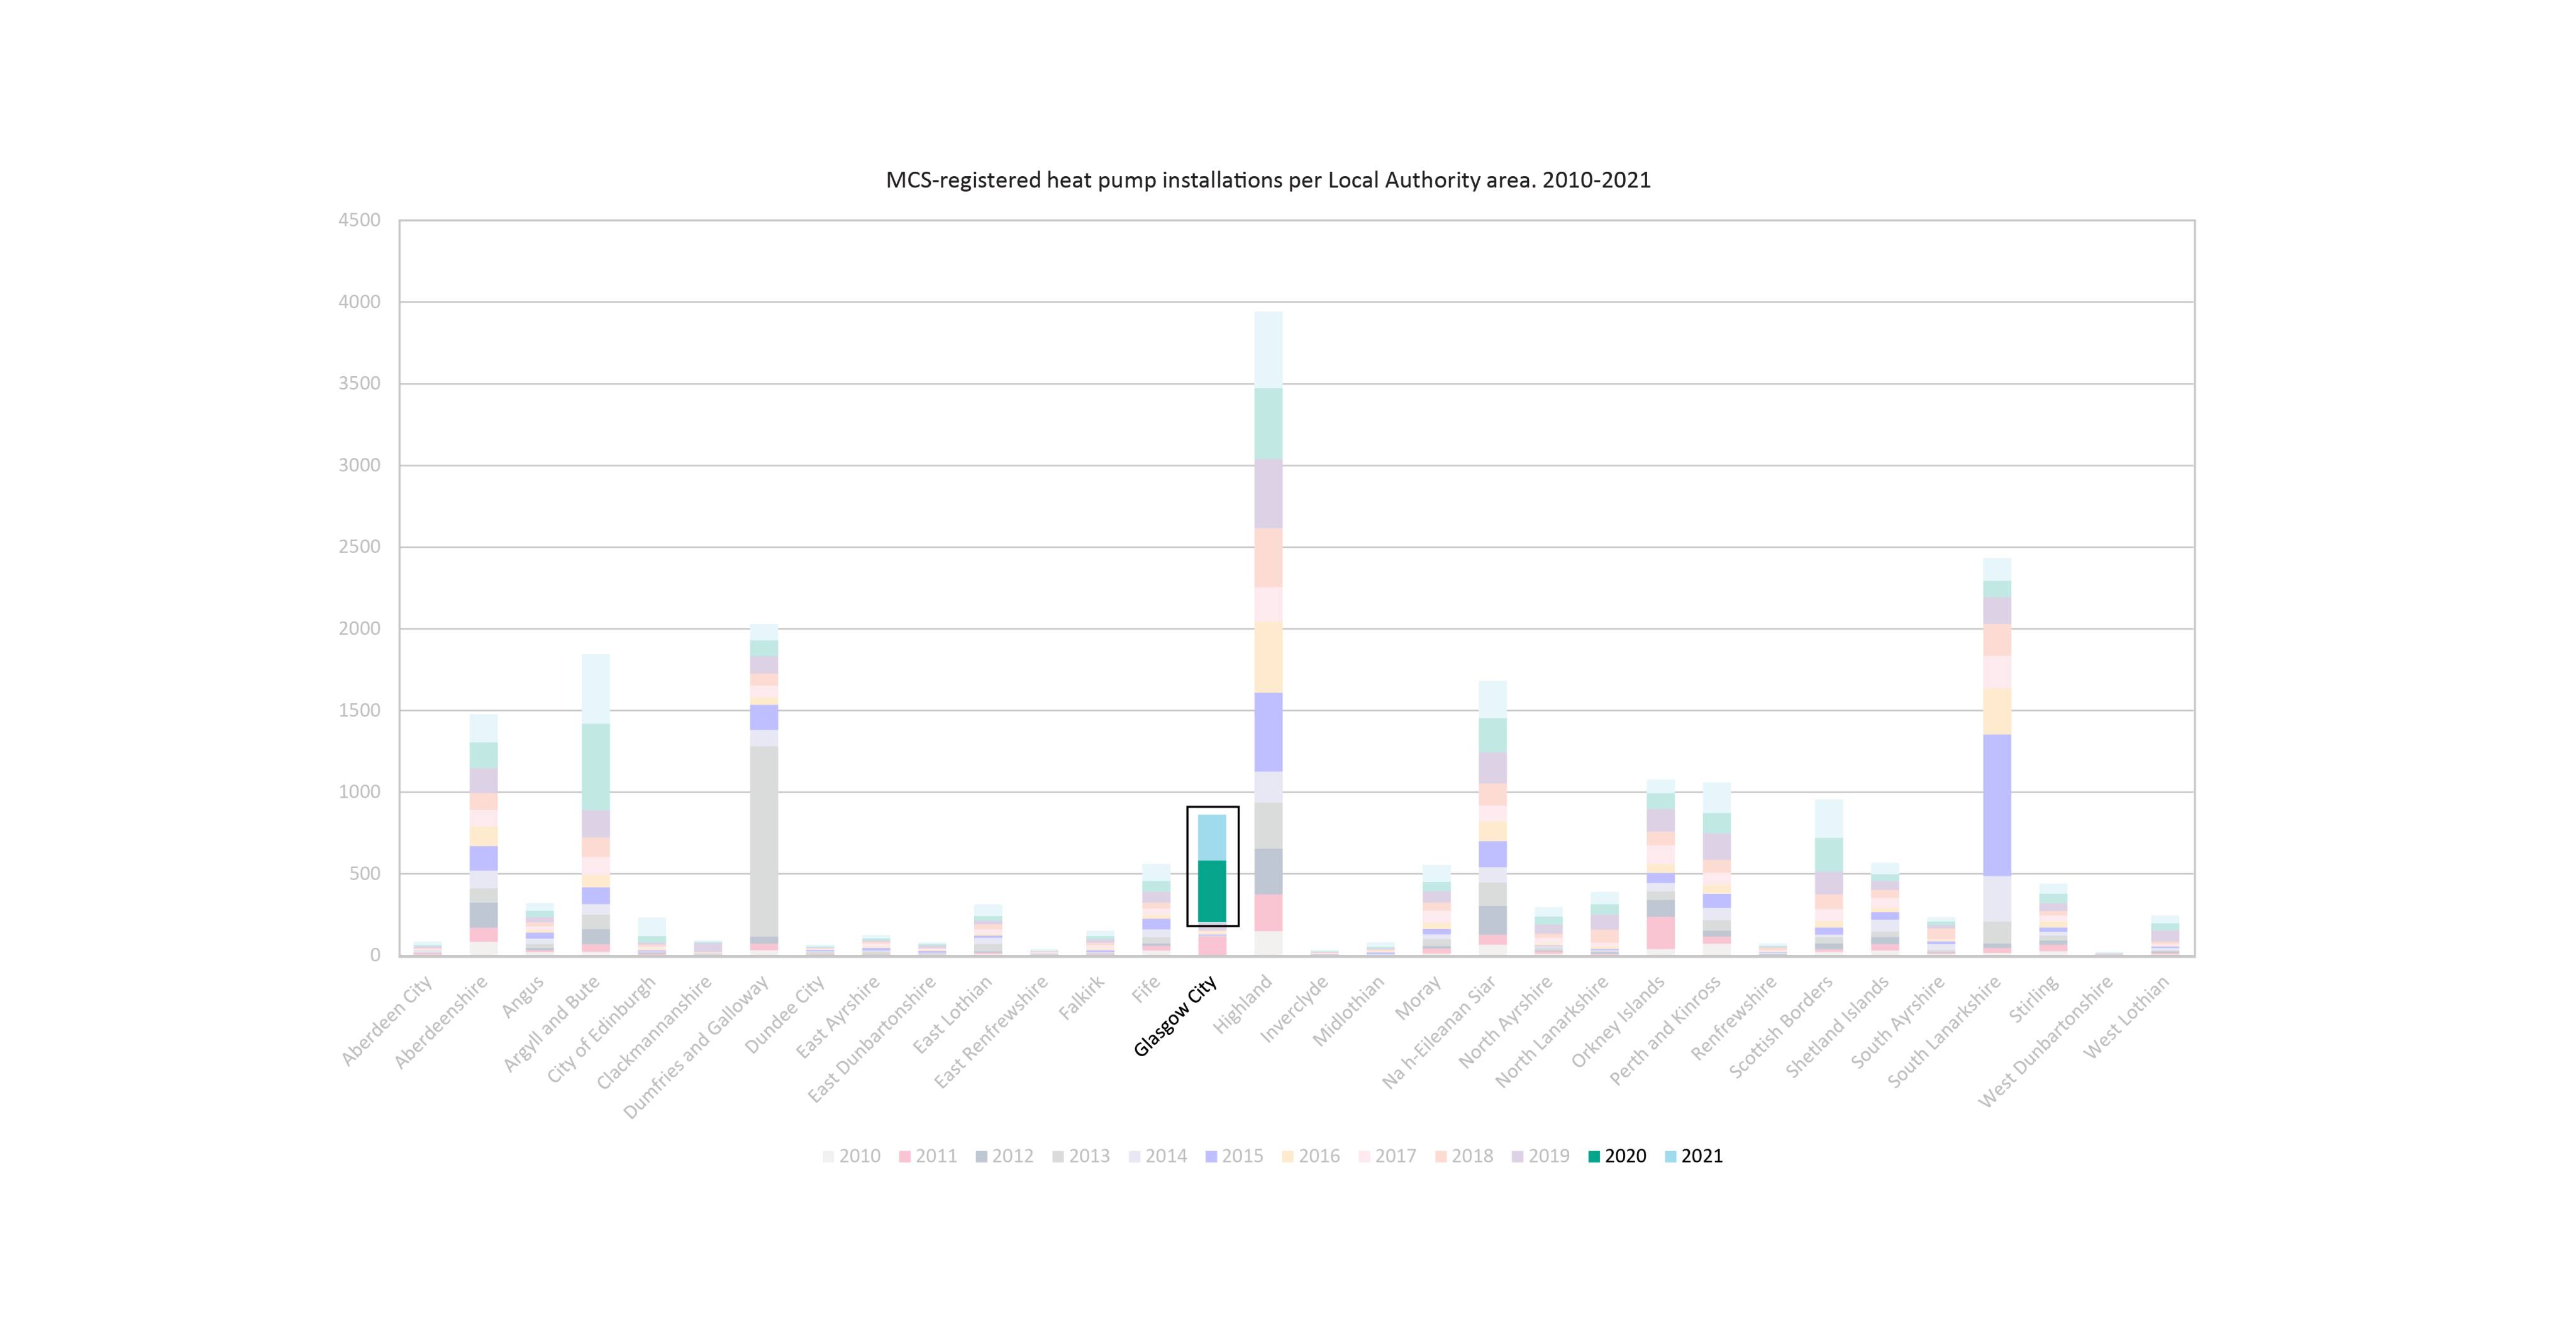
Maryhill Housing Association installed 330 in 2020-2022.
South Lanarkshire Council installed 489 in 2015.

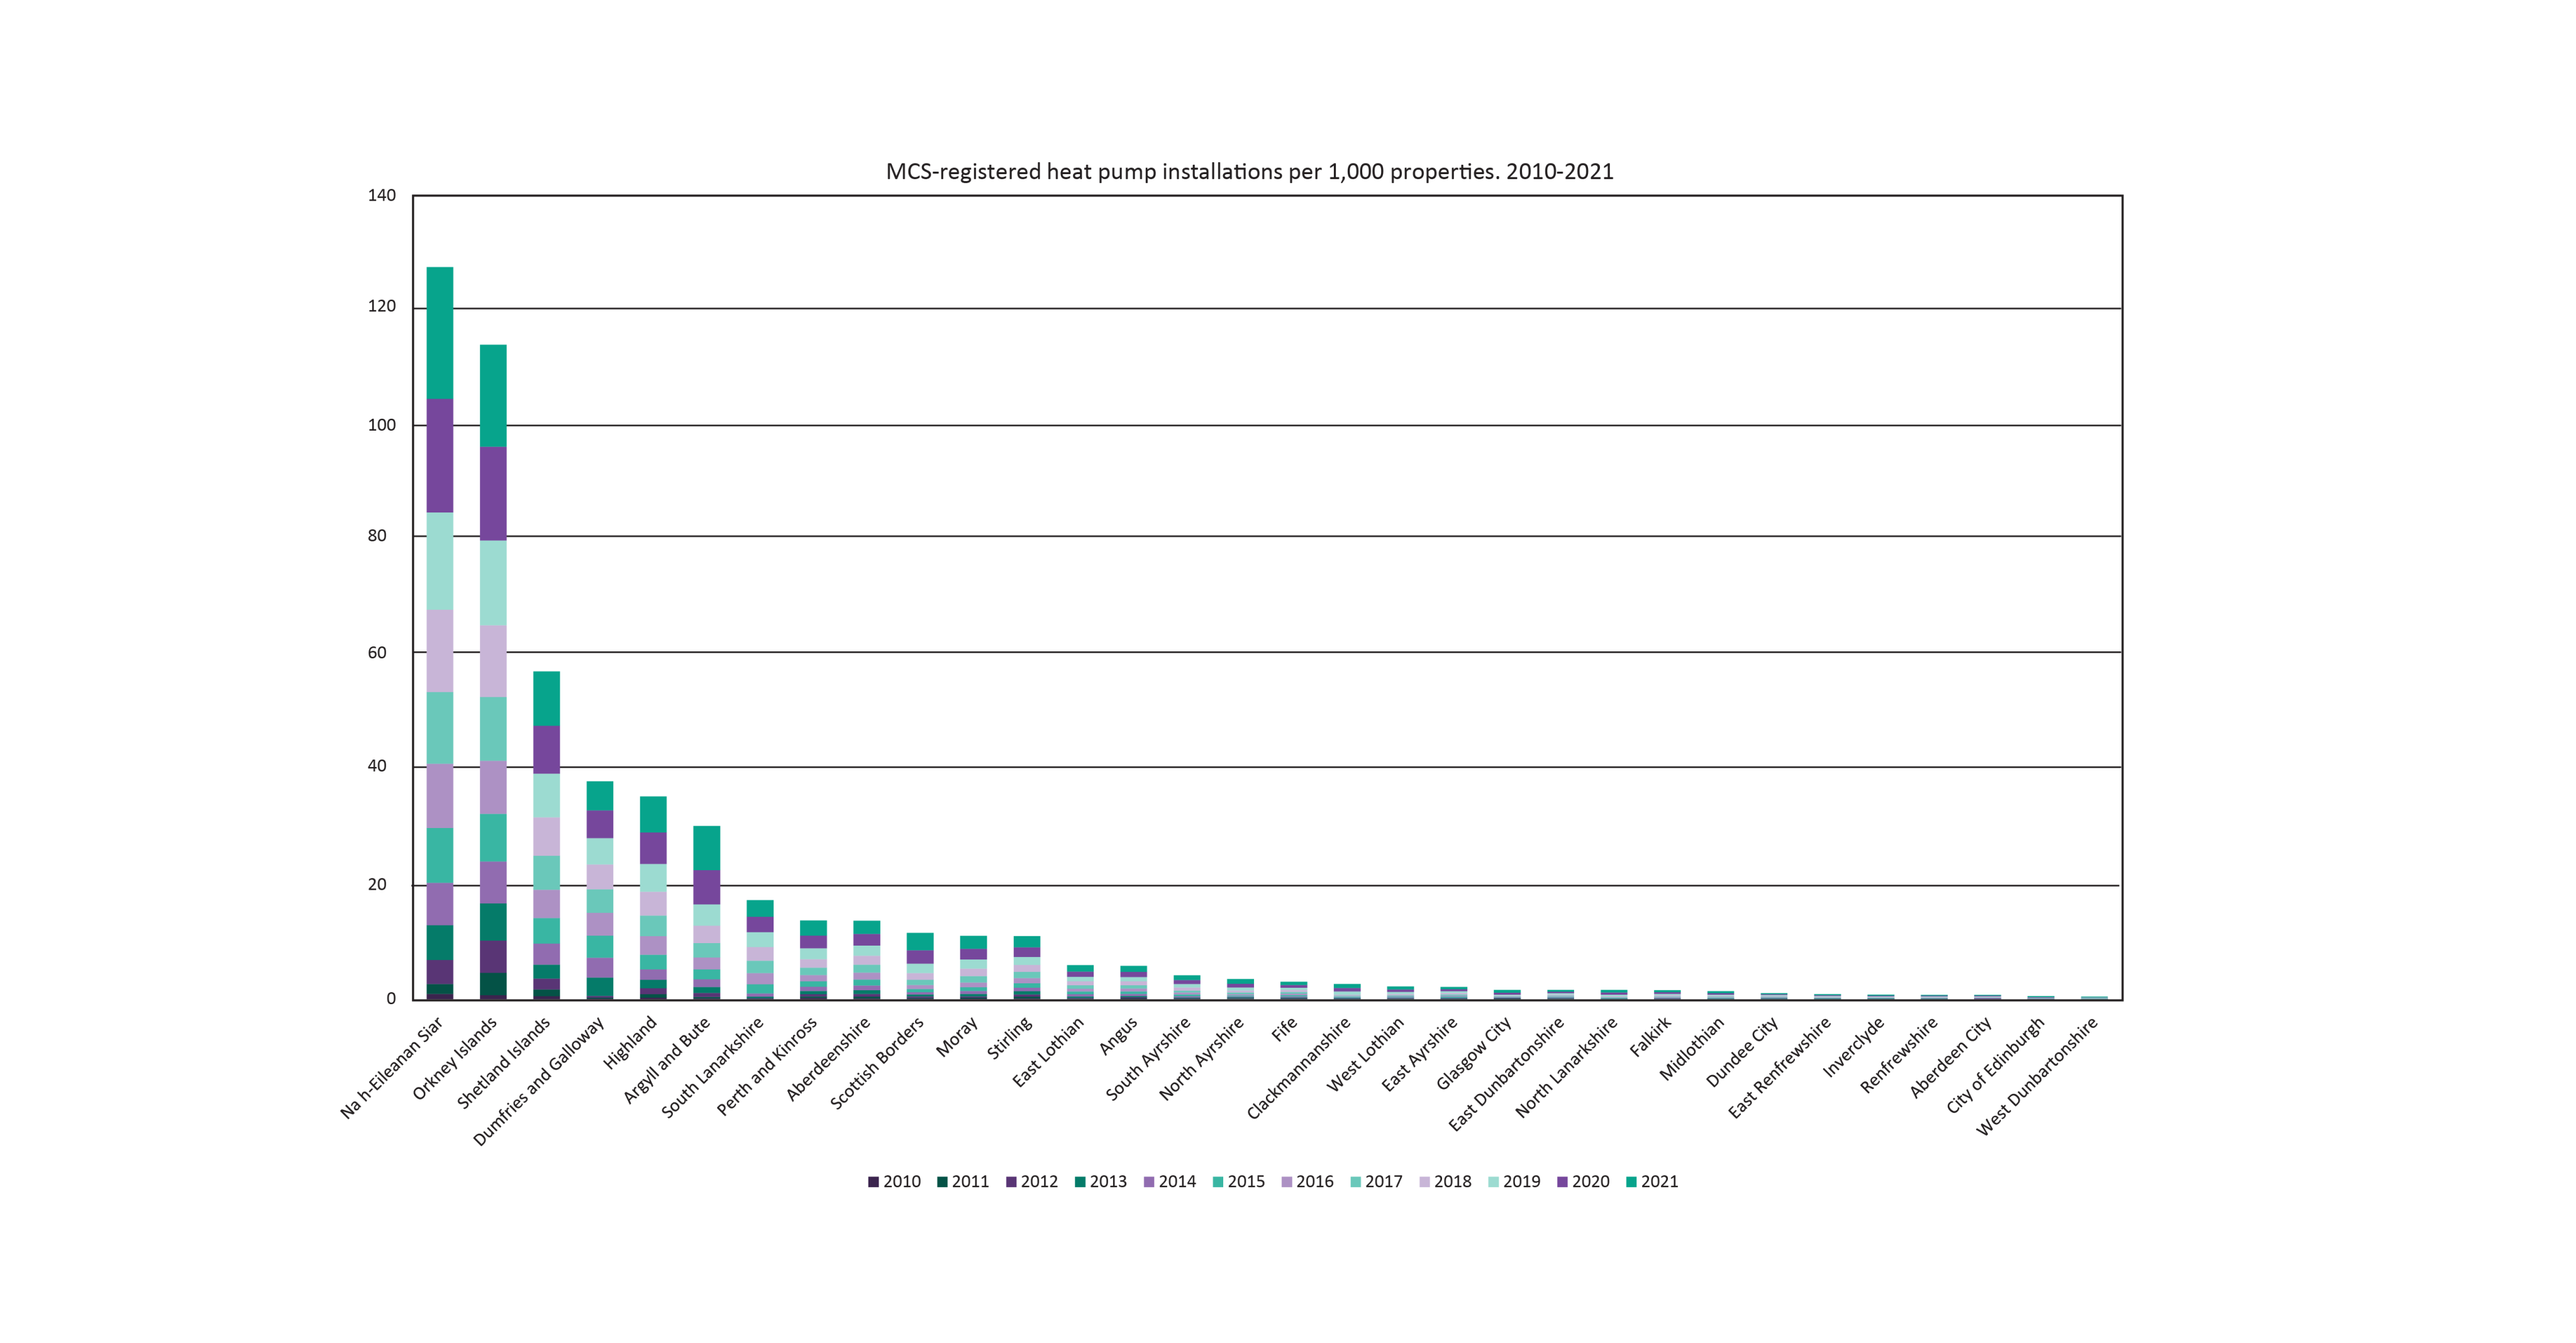


However, each region has a different number of properties. If we look at the number of installations per 1,000 properties, we see a very different picture.
Na h-Eileanan Siar, Orkney Islands and Shetland Islands have by far the most heat pumps per 1,000 properties, even though their absolute numbers are much lower.
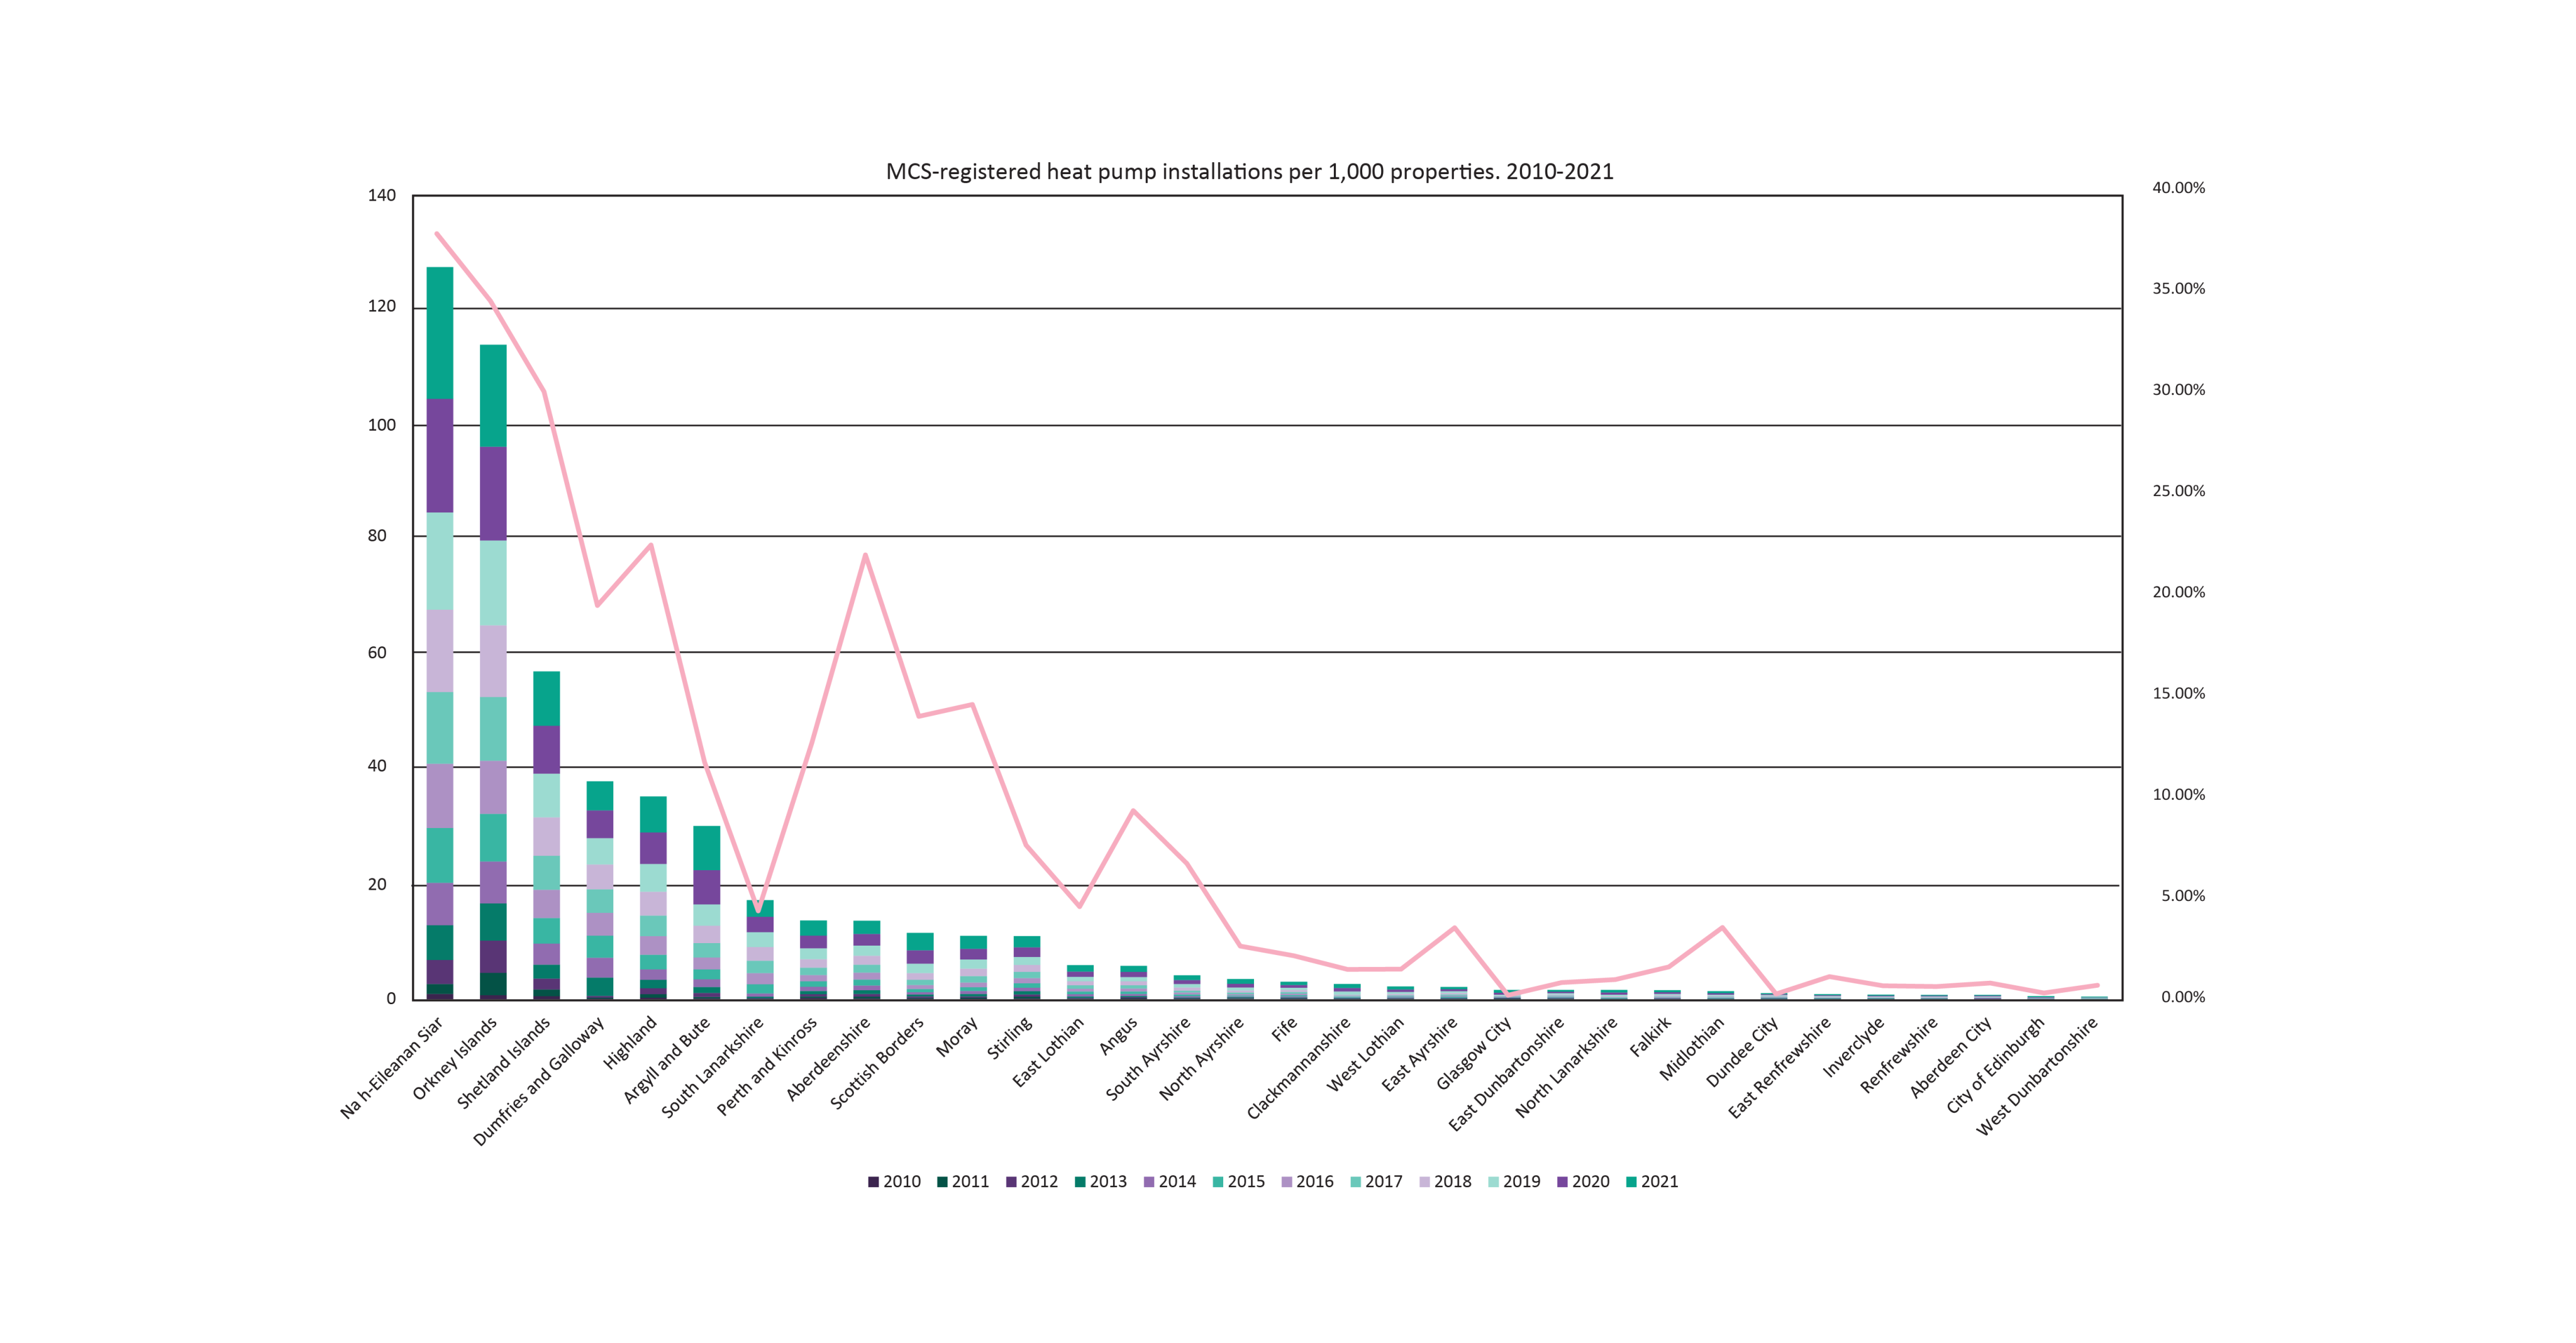
There is a strong correlation between areas that have a high percentage of properties using oil as a primary heating fuel (pink line) and the number of heat pumps installed per 1,000 properties.
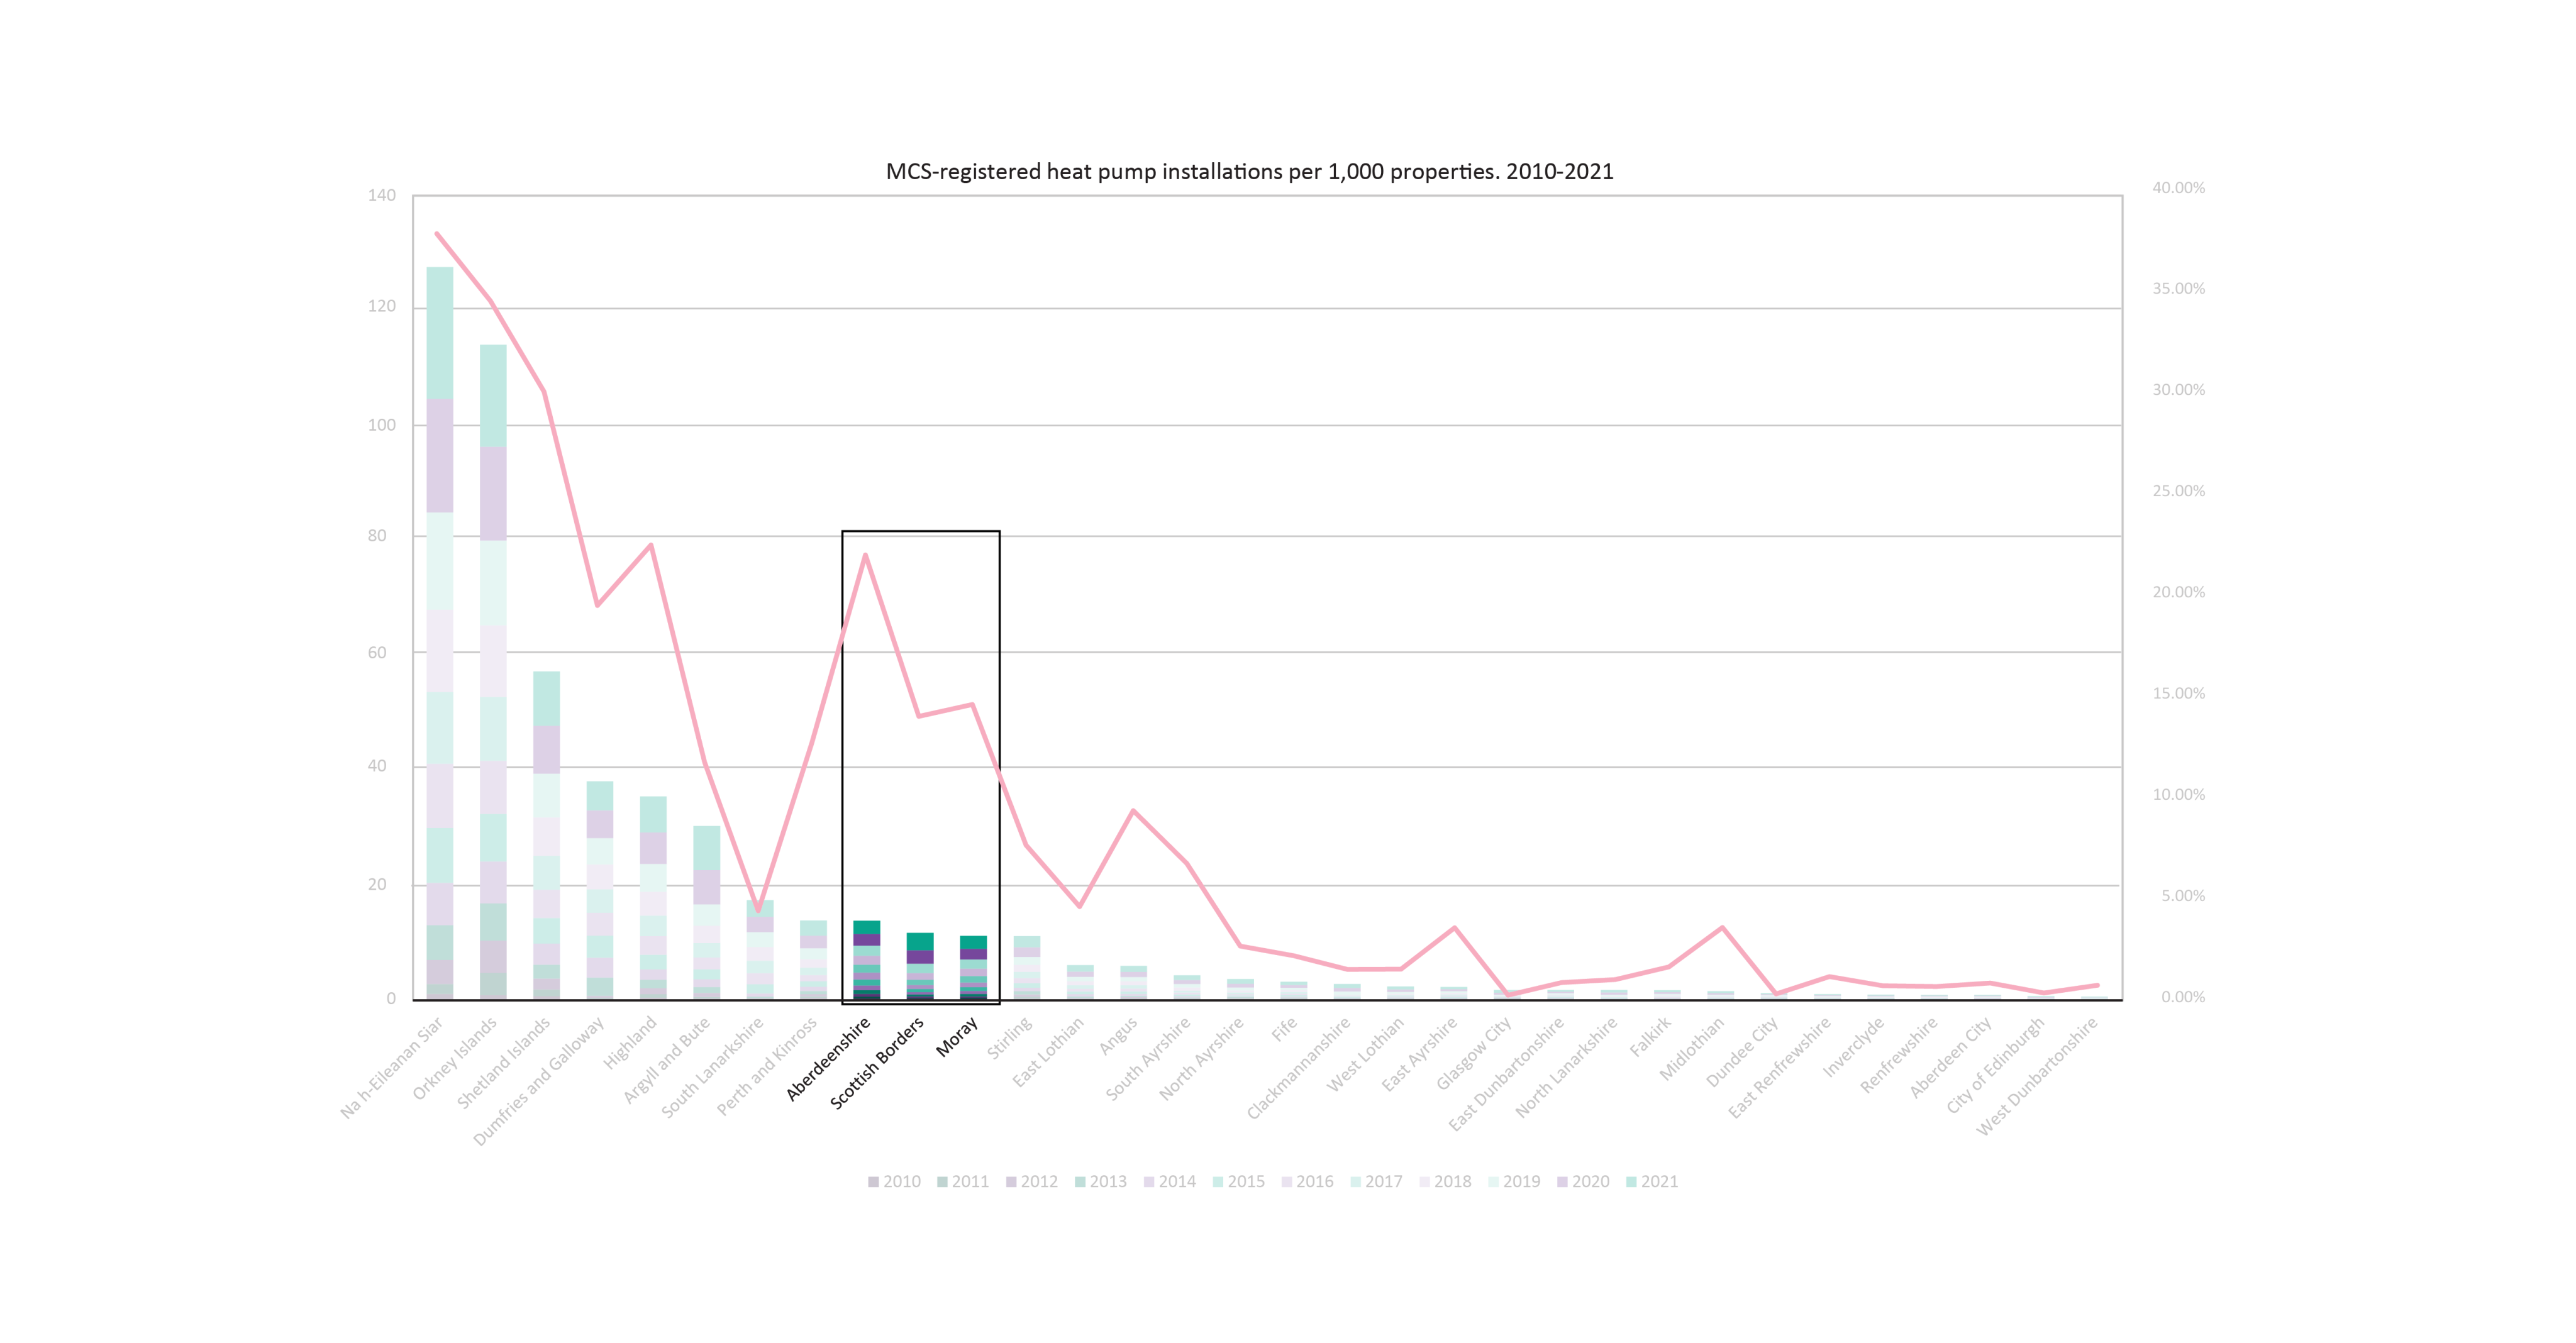
Outliers here are Aberdeenshire (20.4% oil heating), Moray (13.5% oil heating) and Scottish Borders (12.9% oil heating), which have a moderately high proportion of oil-fuelled heating systems, but a relatively low number of heat pumps.
To read more about mapping the location of heat pumps across Great Britain, read our Medium blog Where are all the heat pumps?
On the whole, heat pumps are not being installed to replace gas boilers, but to replace oil boilers. Oil boilers are more costly to install and run than gas boilers meaning that a heat pump is a closer economical comparison, while households on gas are remaining on gas.
The differences between local authorities further strengthens the argument for a localised and stratified model of heat pump growth.
Next, it is important to understand the scale of the challenge. How many heat pumps do the various targets and regulations require?
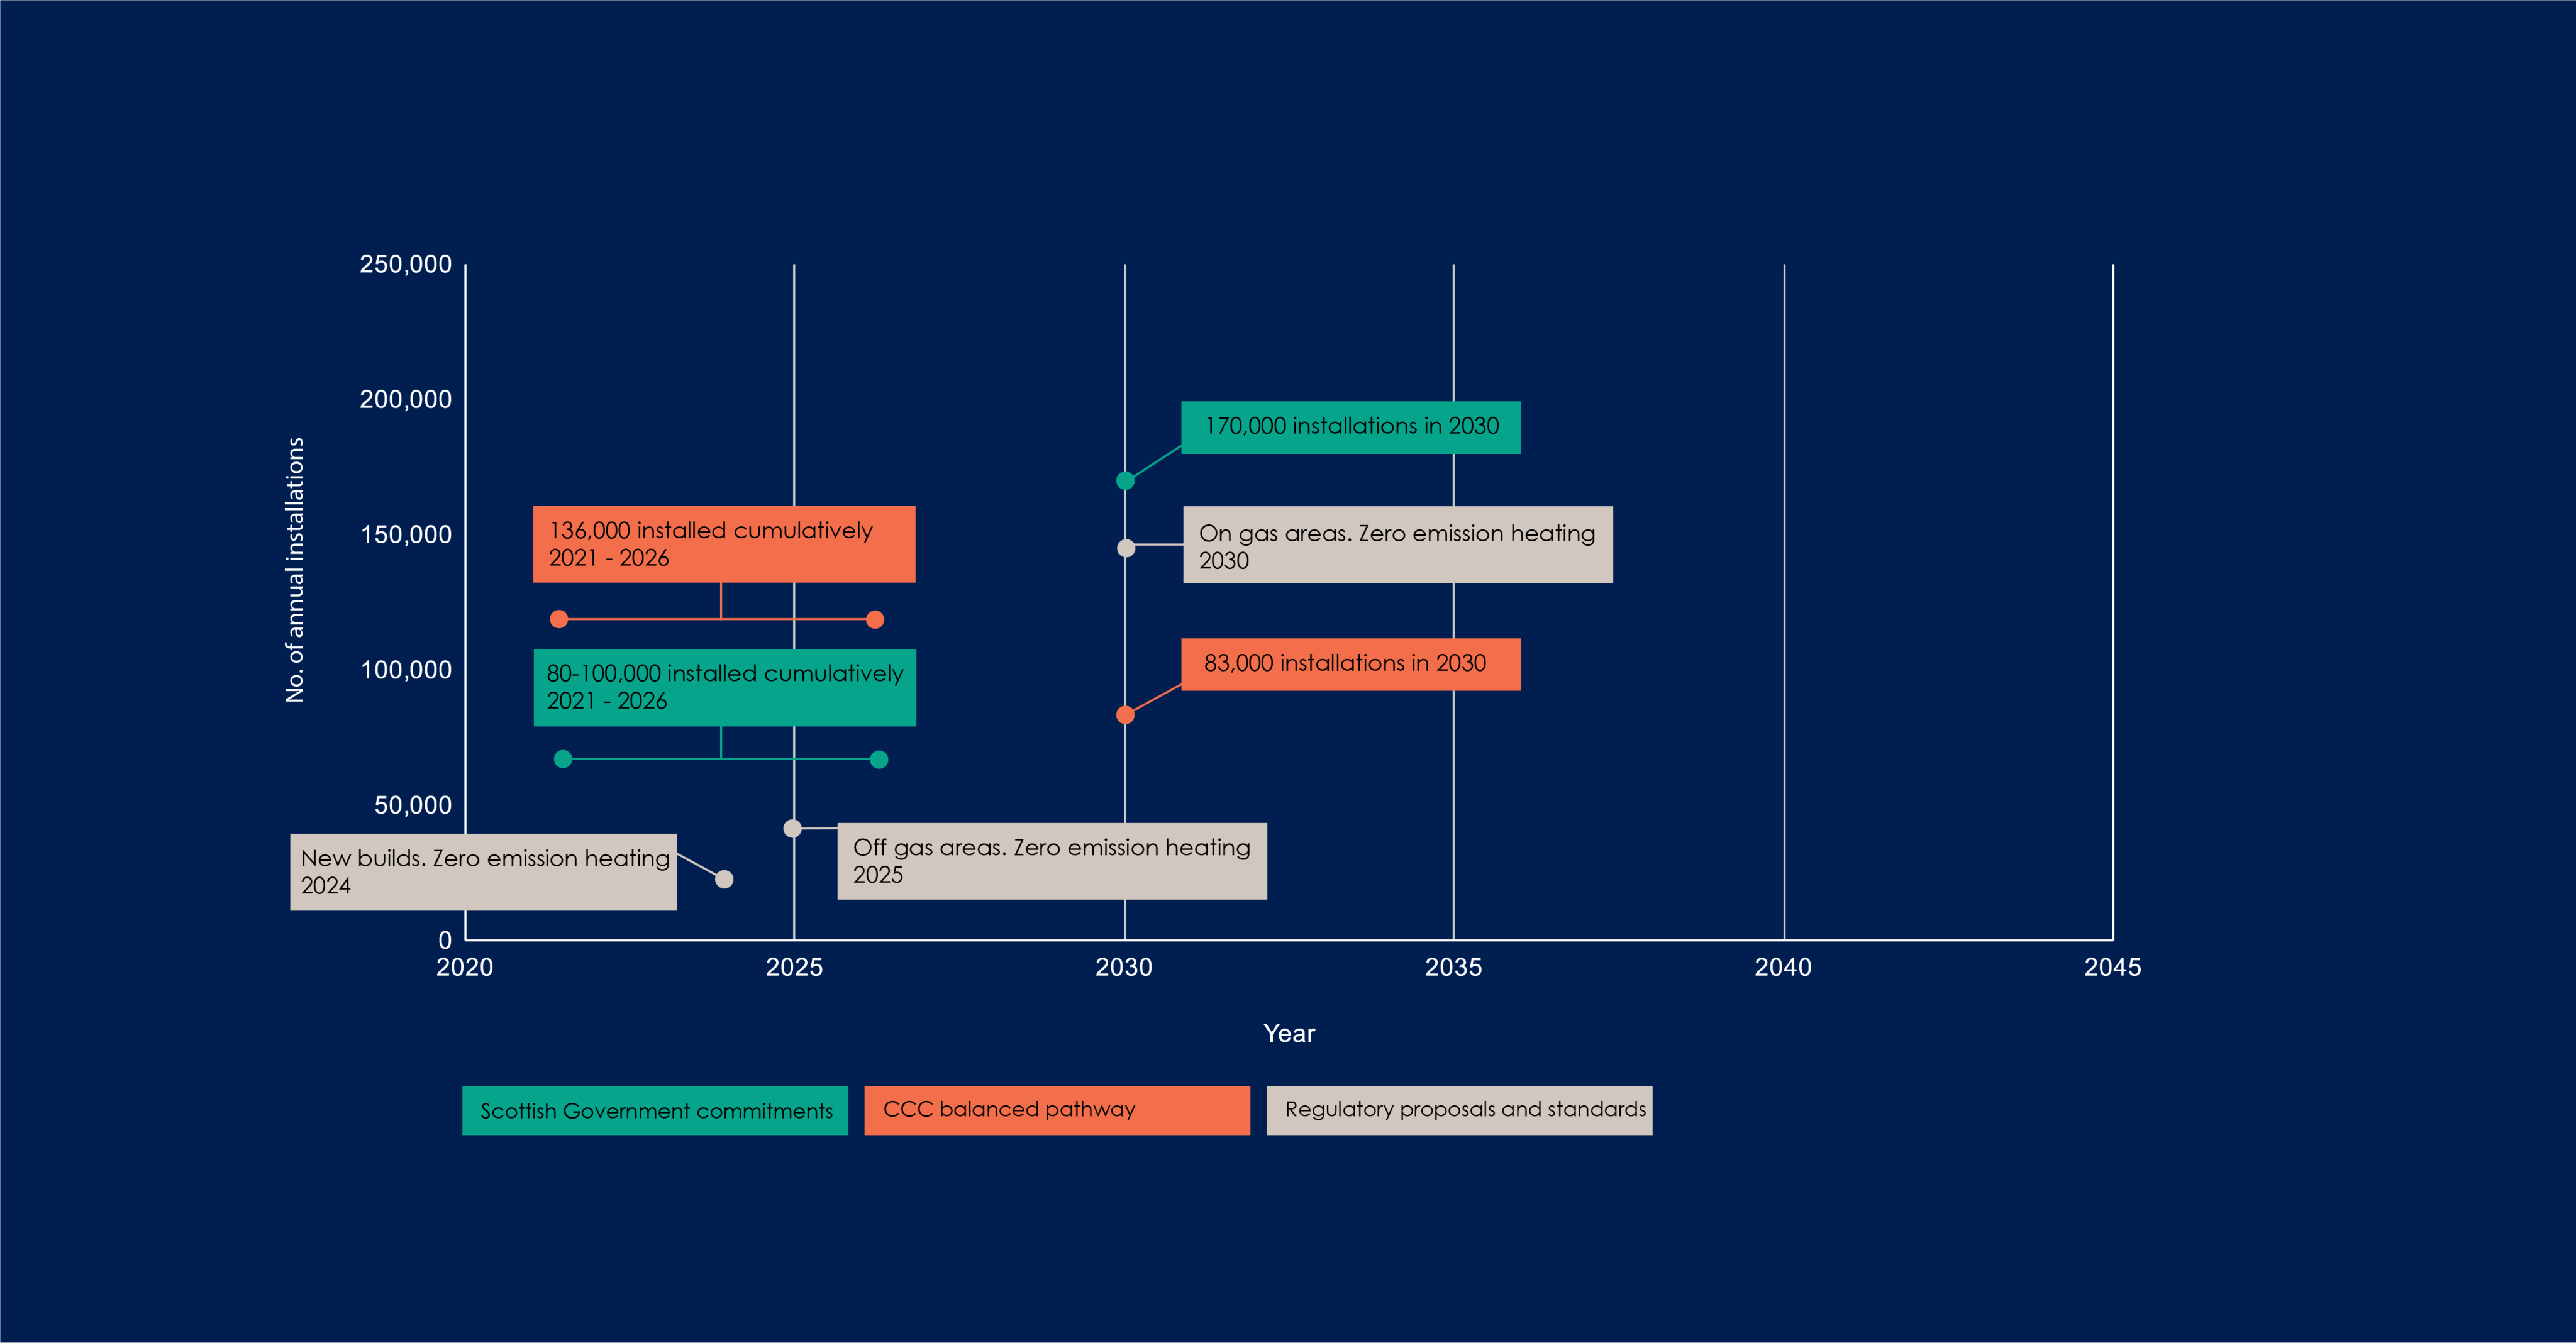
We have used three sets of data to create three timelines:
Scottish Government commitments
- 80,000-100,000 heat pumps installed cumulatively over 2021-2026
- 170,000 installations in 2030
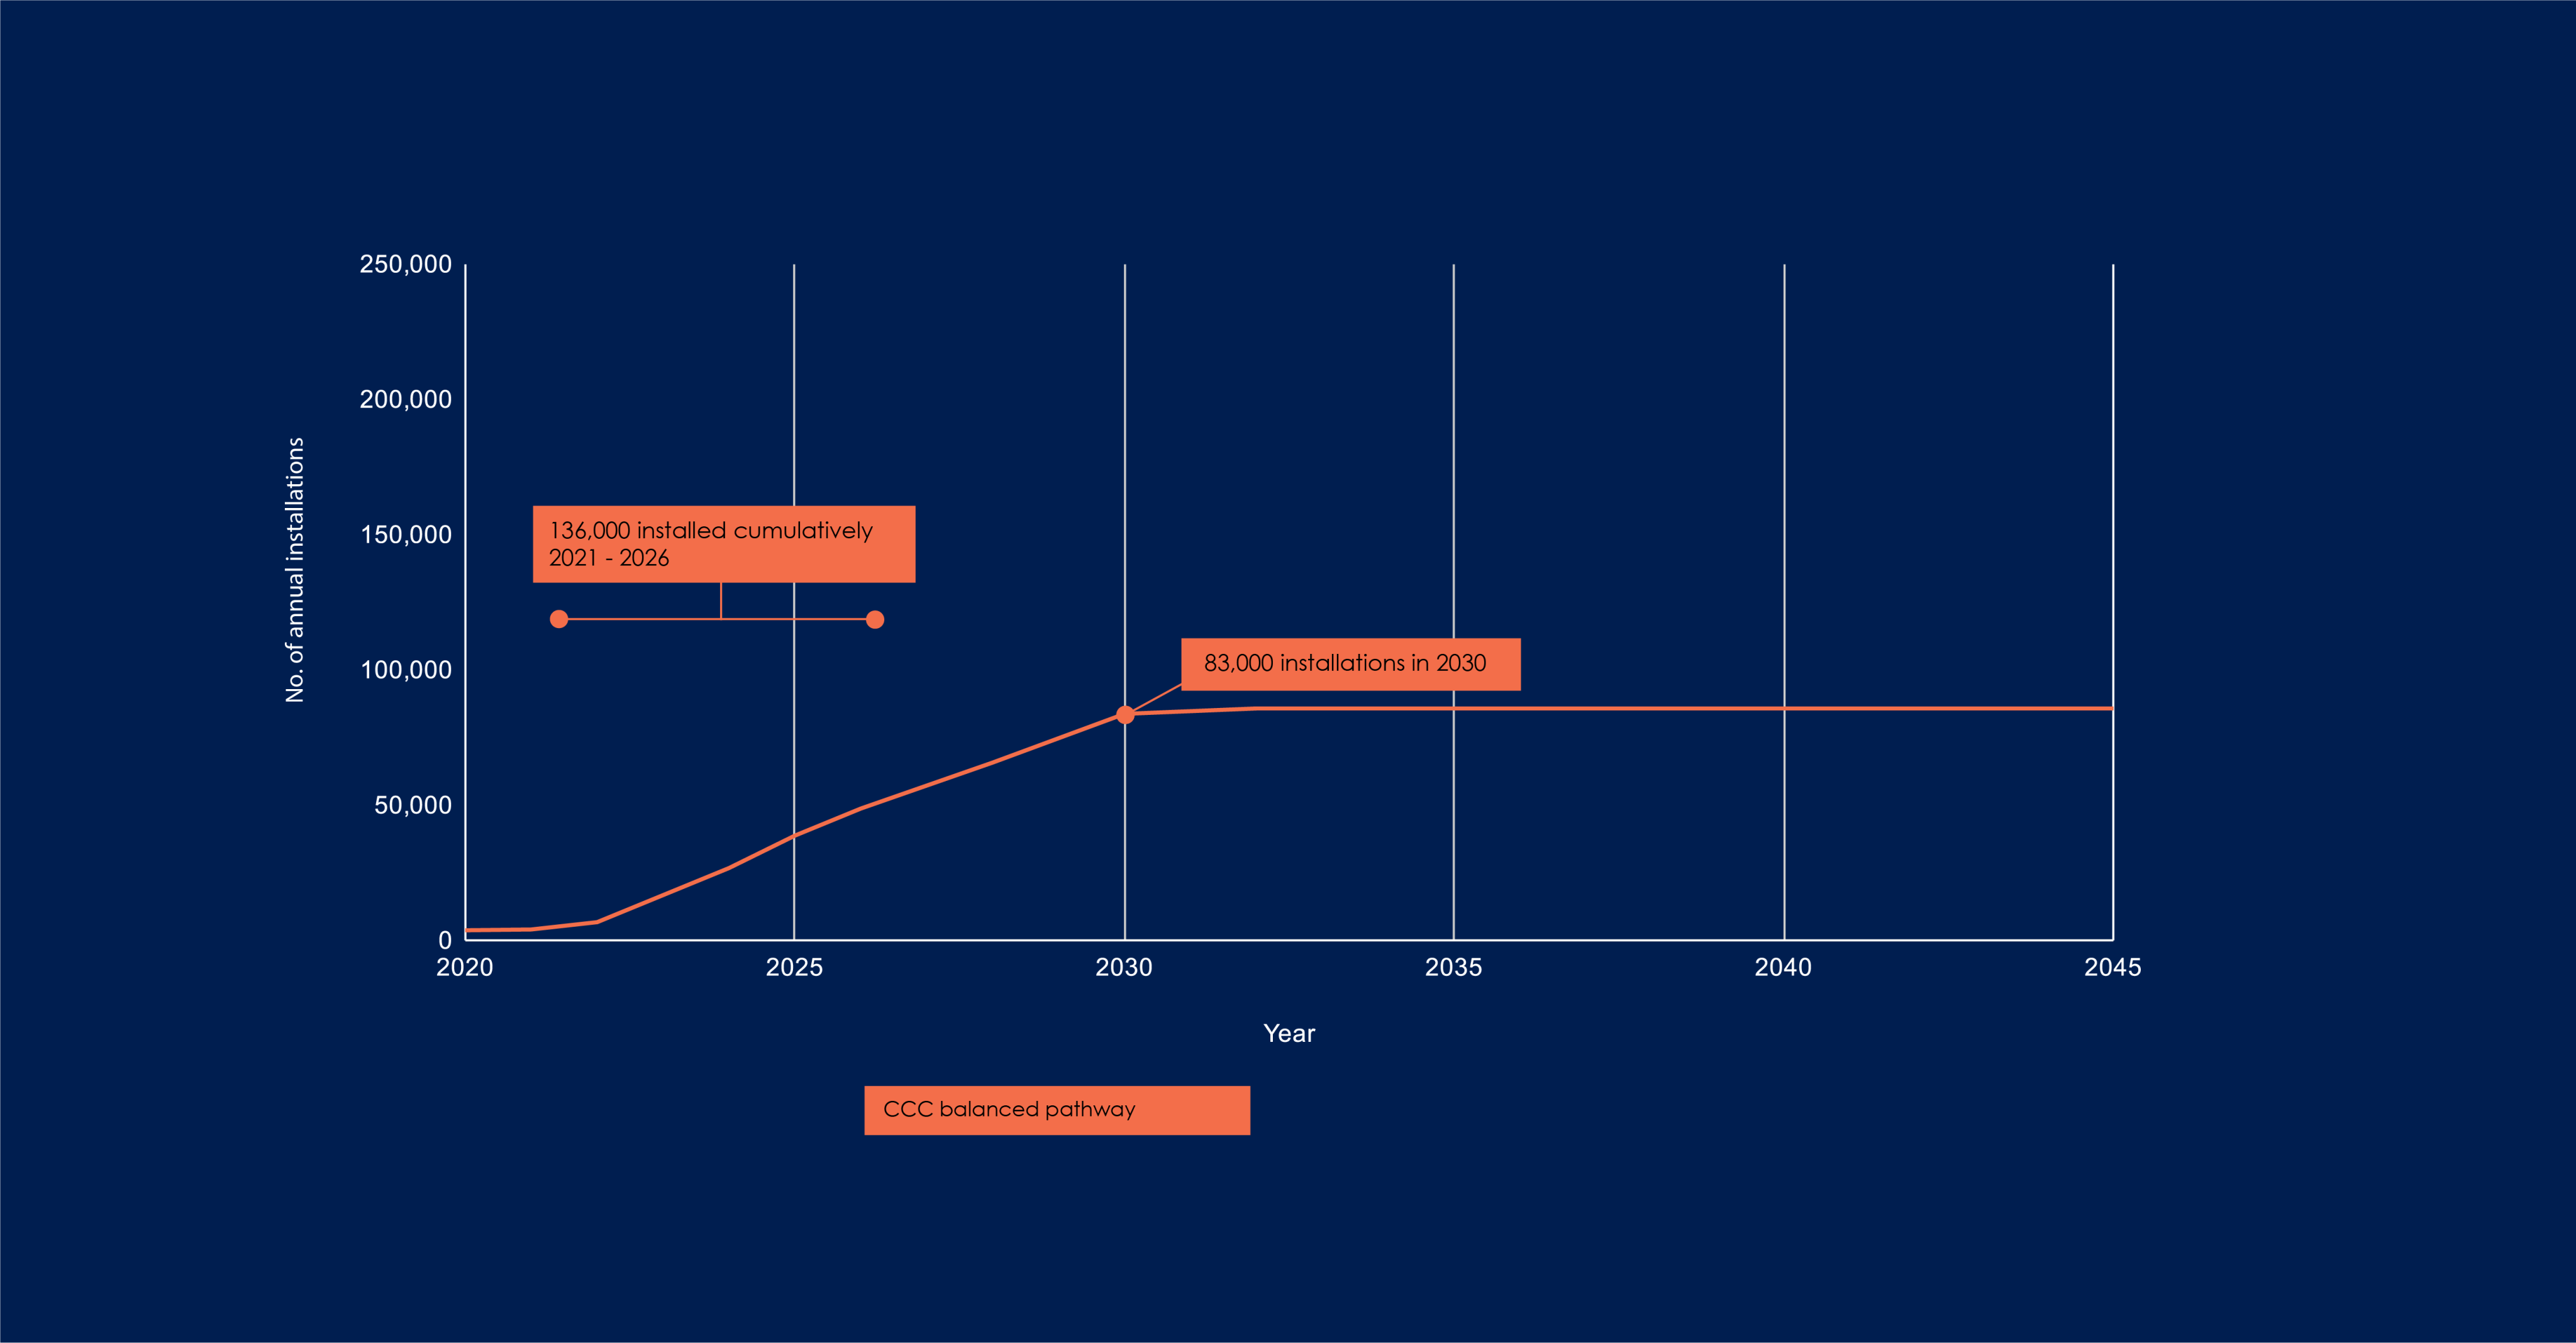
Climate Change Commission (CCC) 'balanced pathway’
- 136,000 heat pumps installed cumulatively over 2021-26
- 83,000 installations in 2030
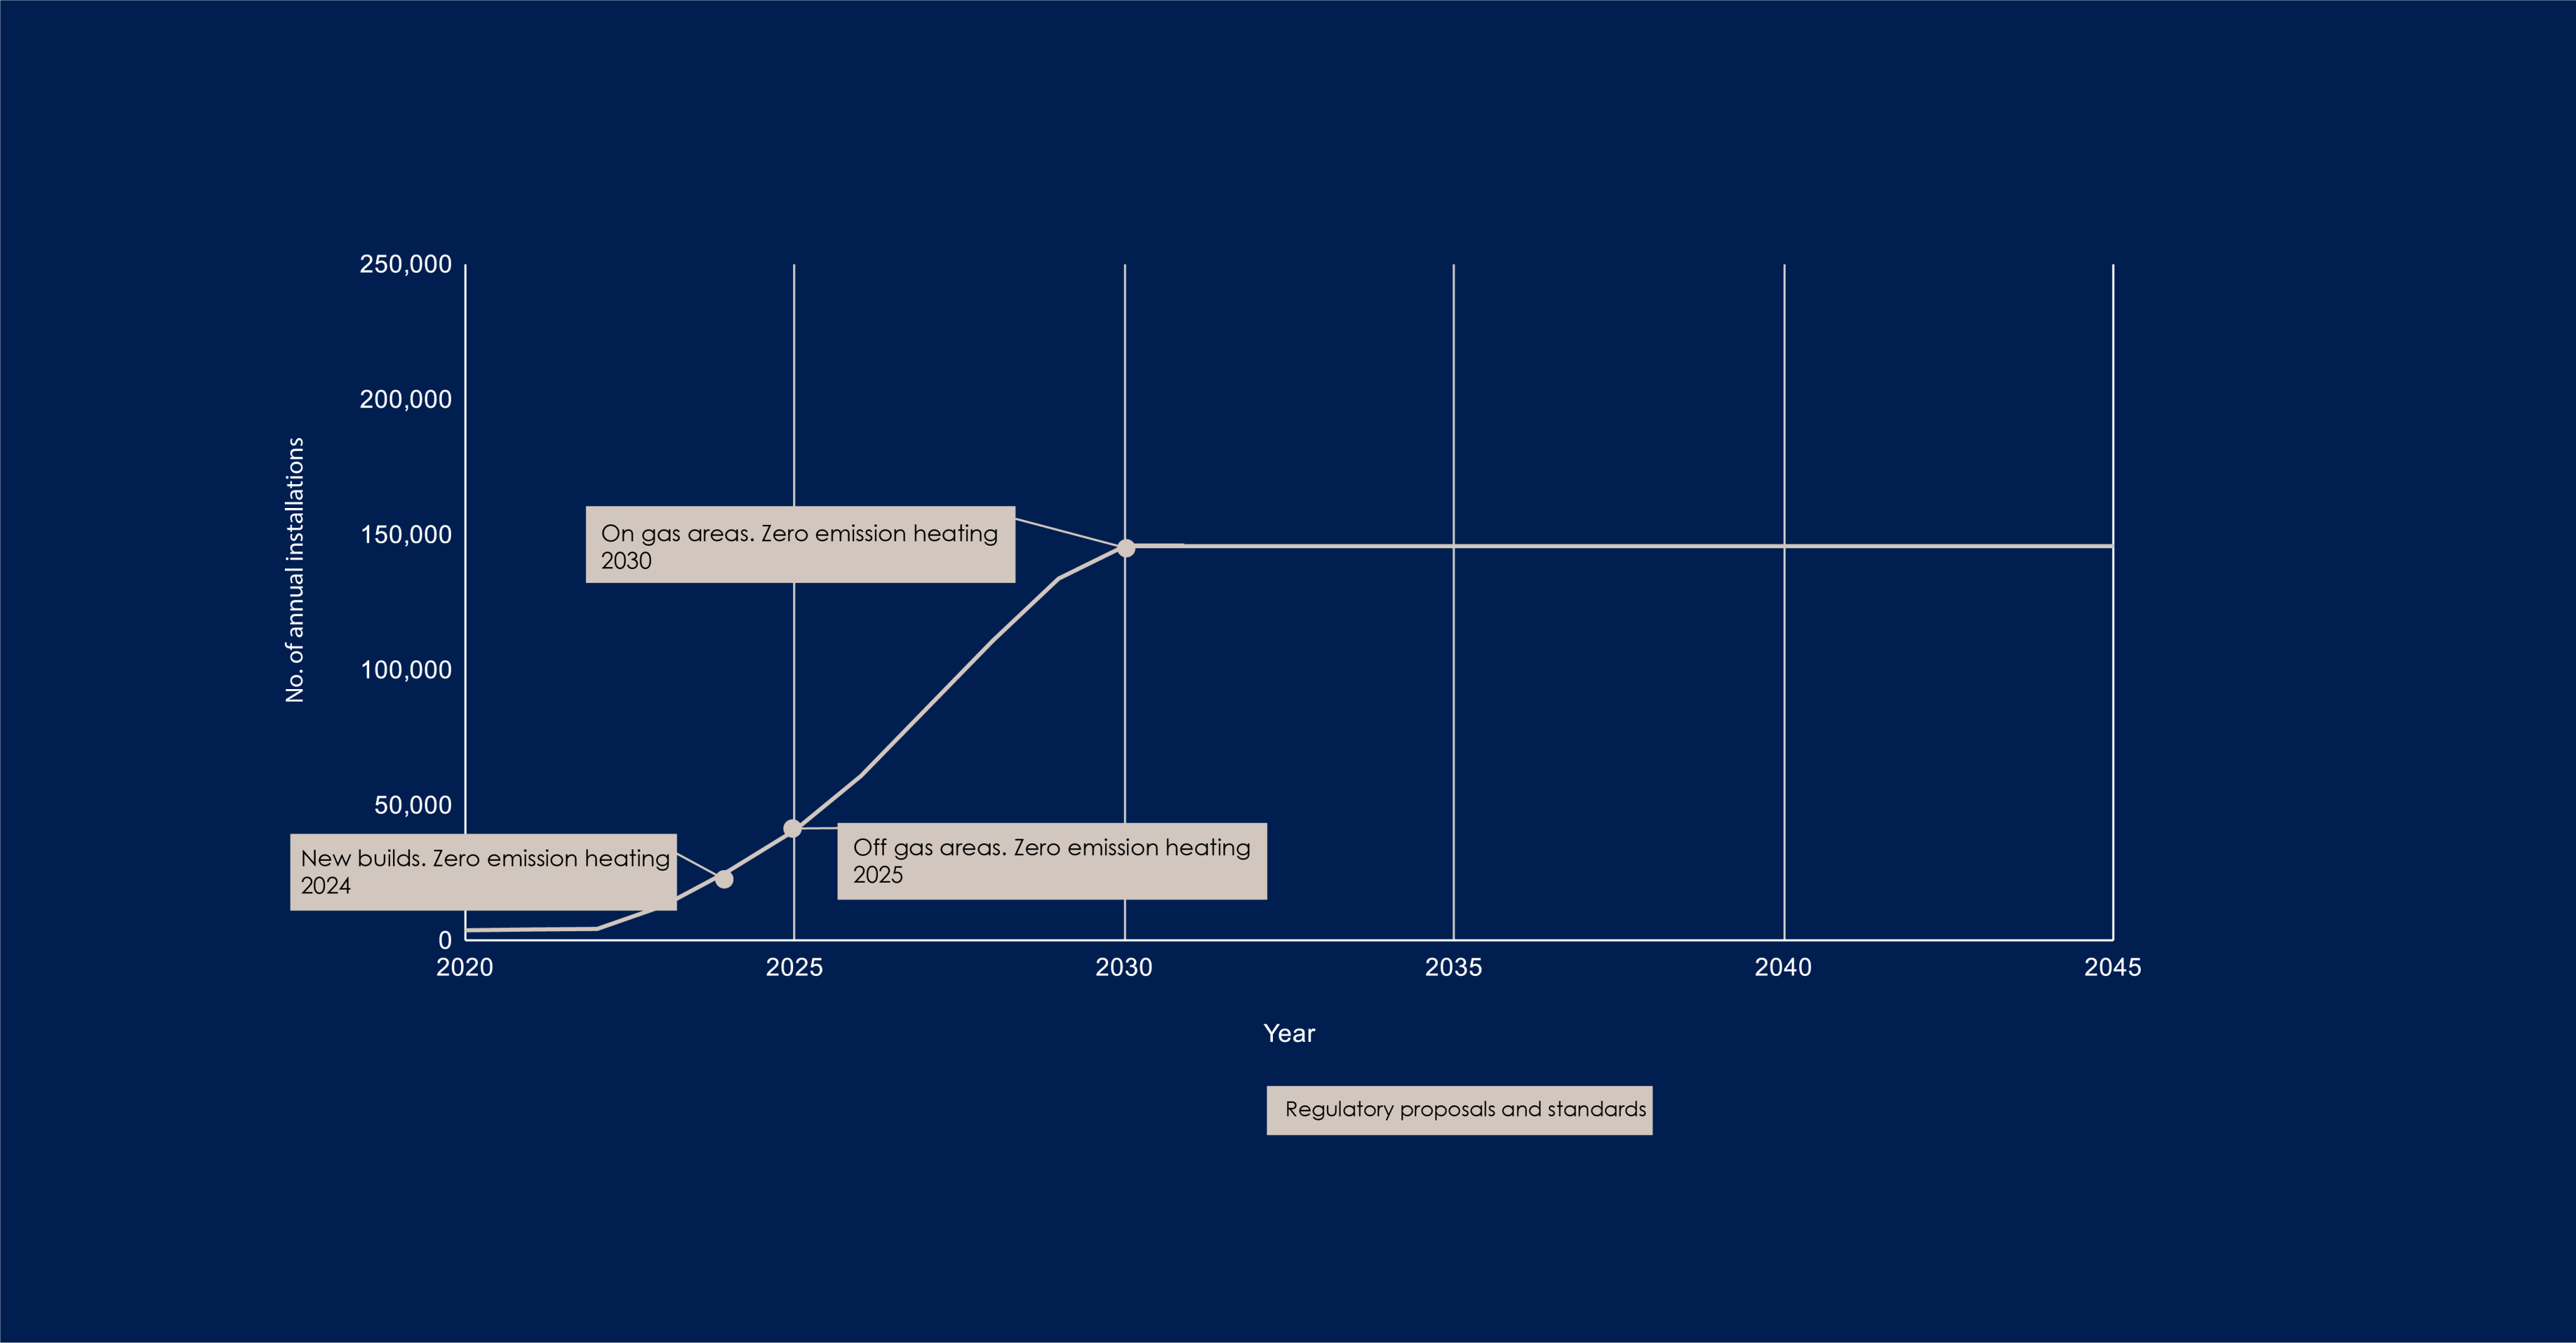
Scottish Government regulatory proposals and standards
- no new fossil fuel installations in new builds from 2024
- no oil replacements from 2025
- no gas replacements from 2030
Plotting these points onto a timeline


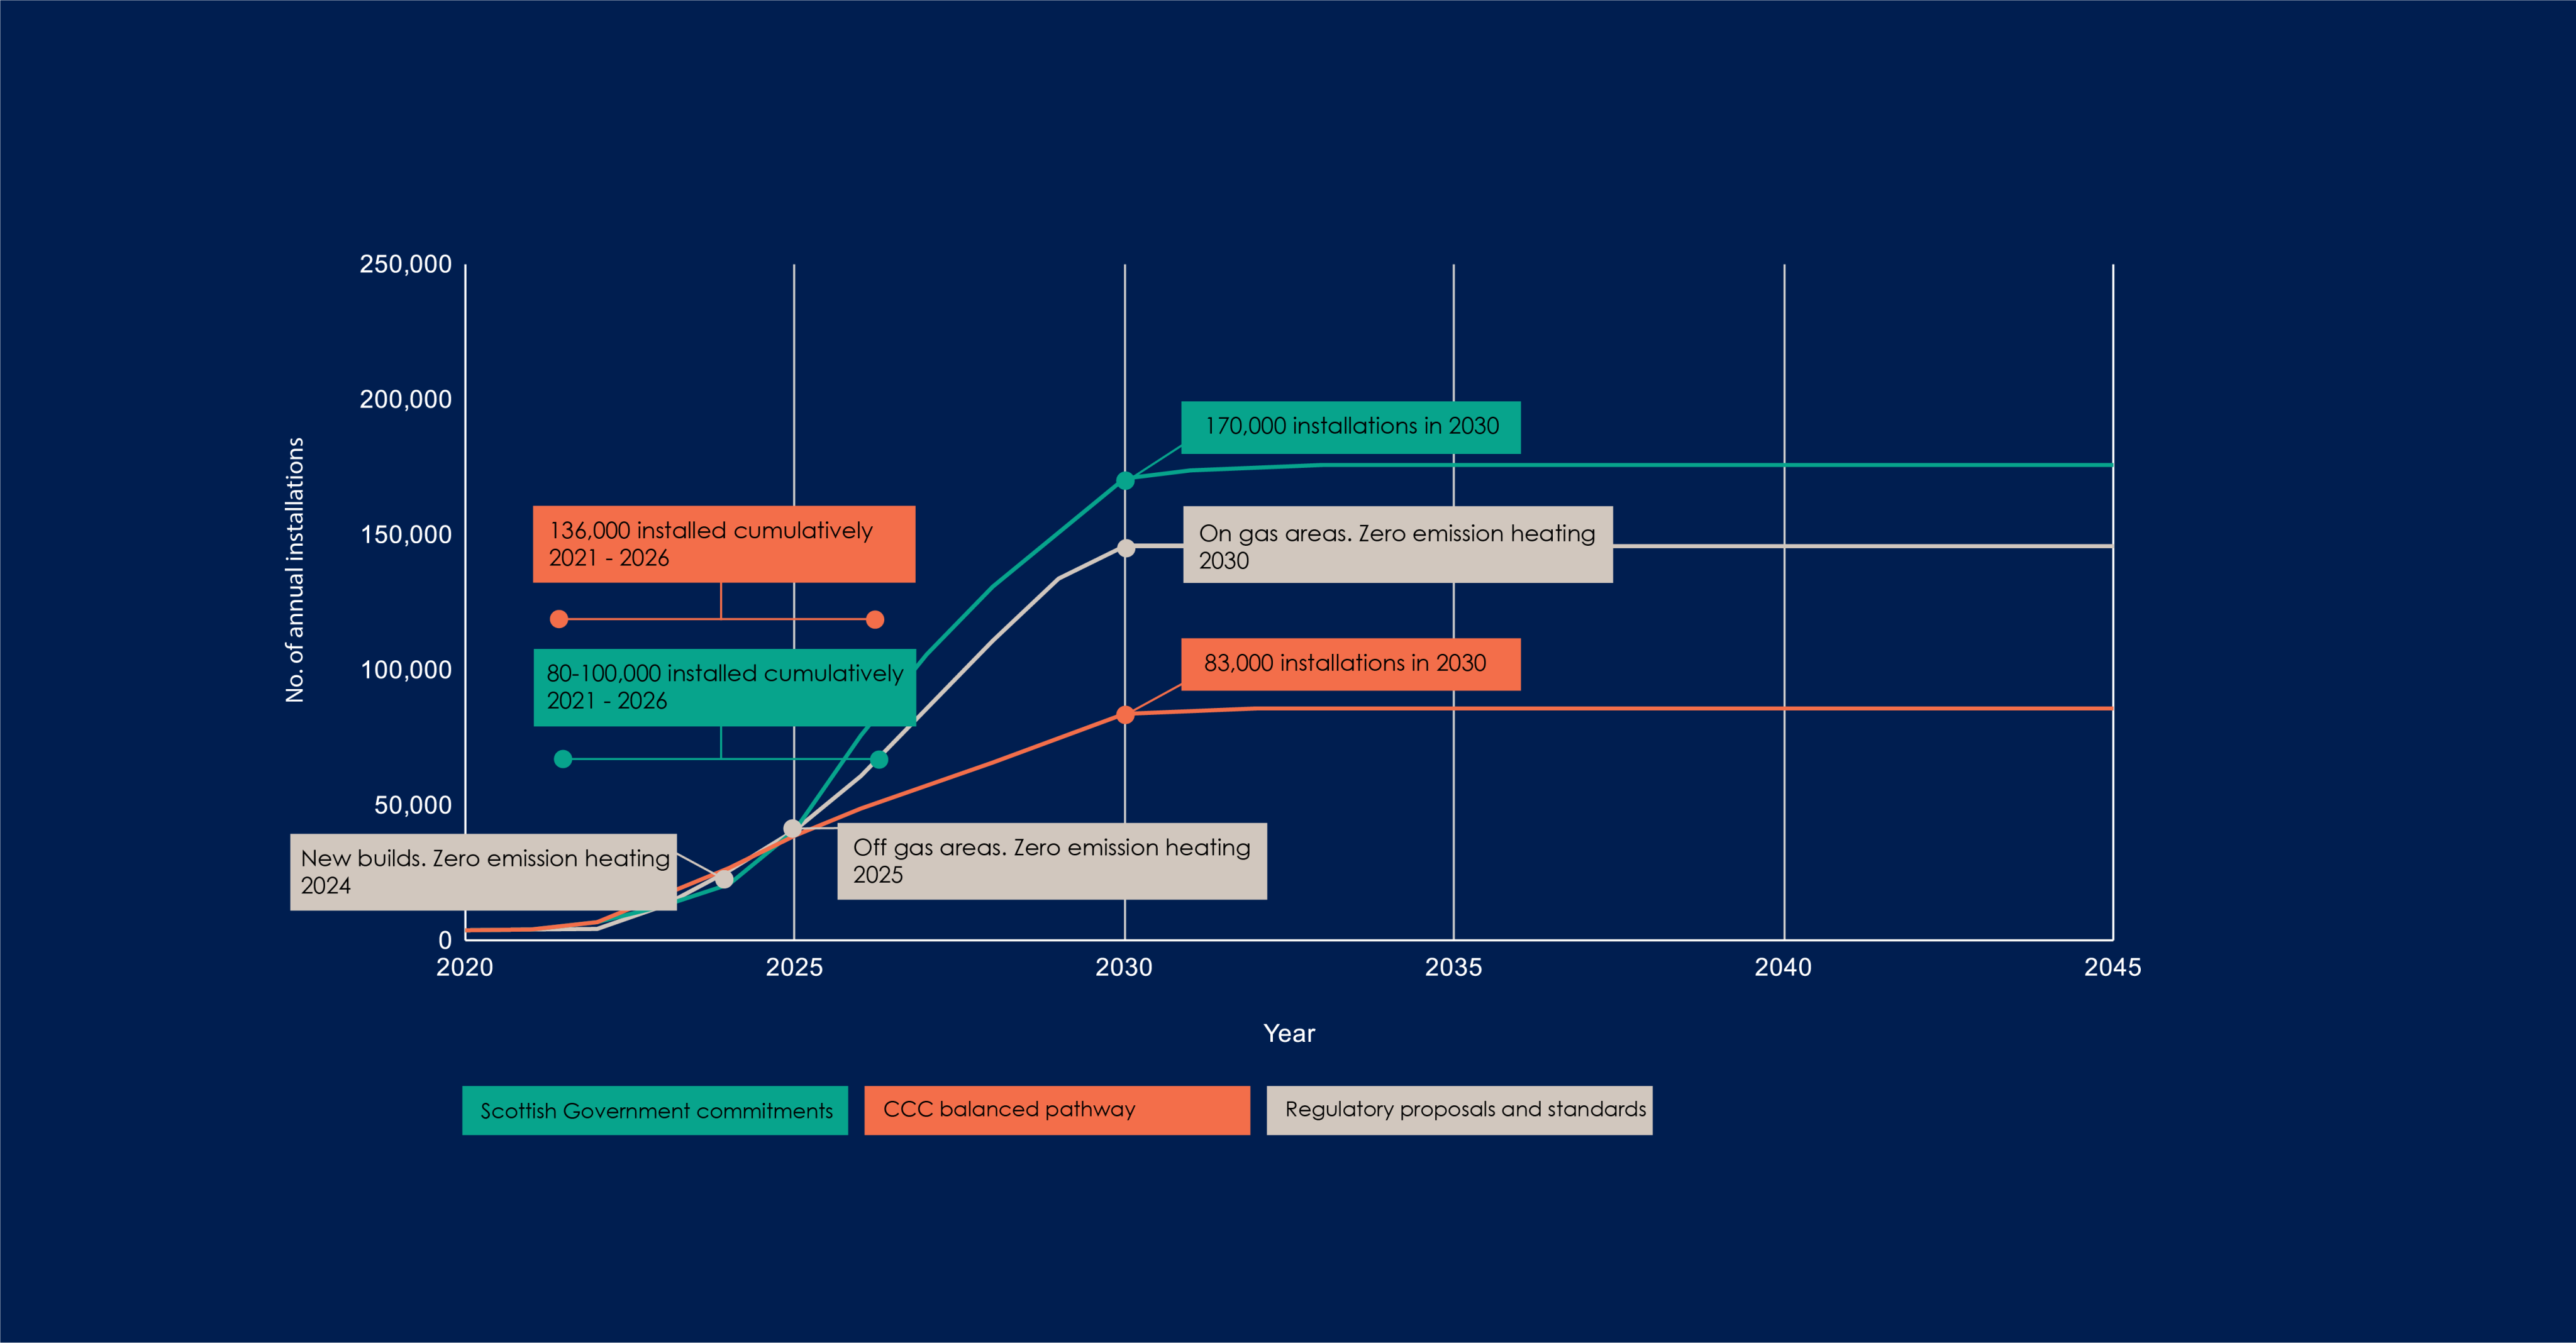
Using these data points we can start to get an idea of how installations need to grow year on year to reach our targets.

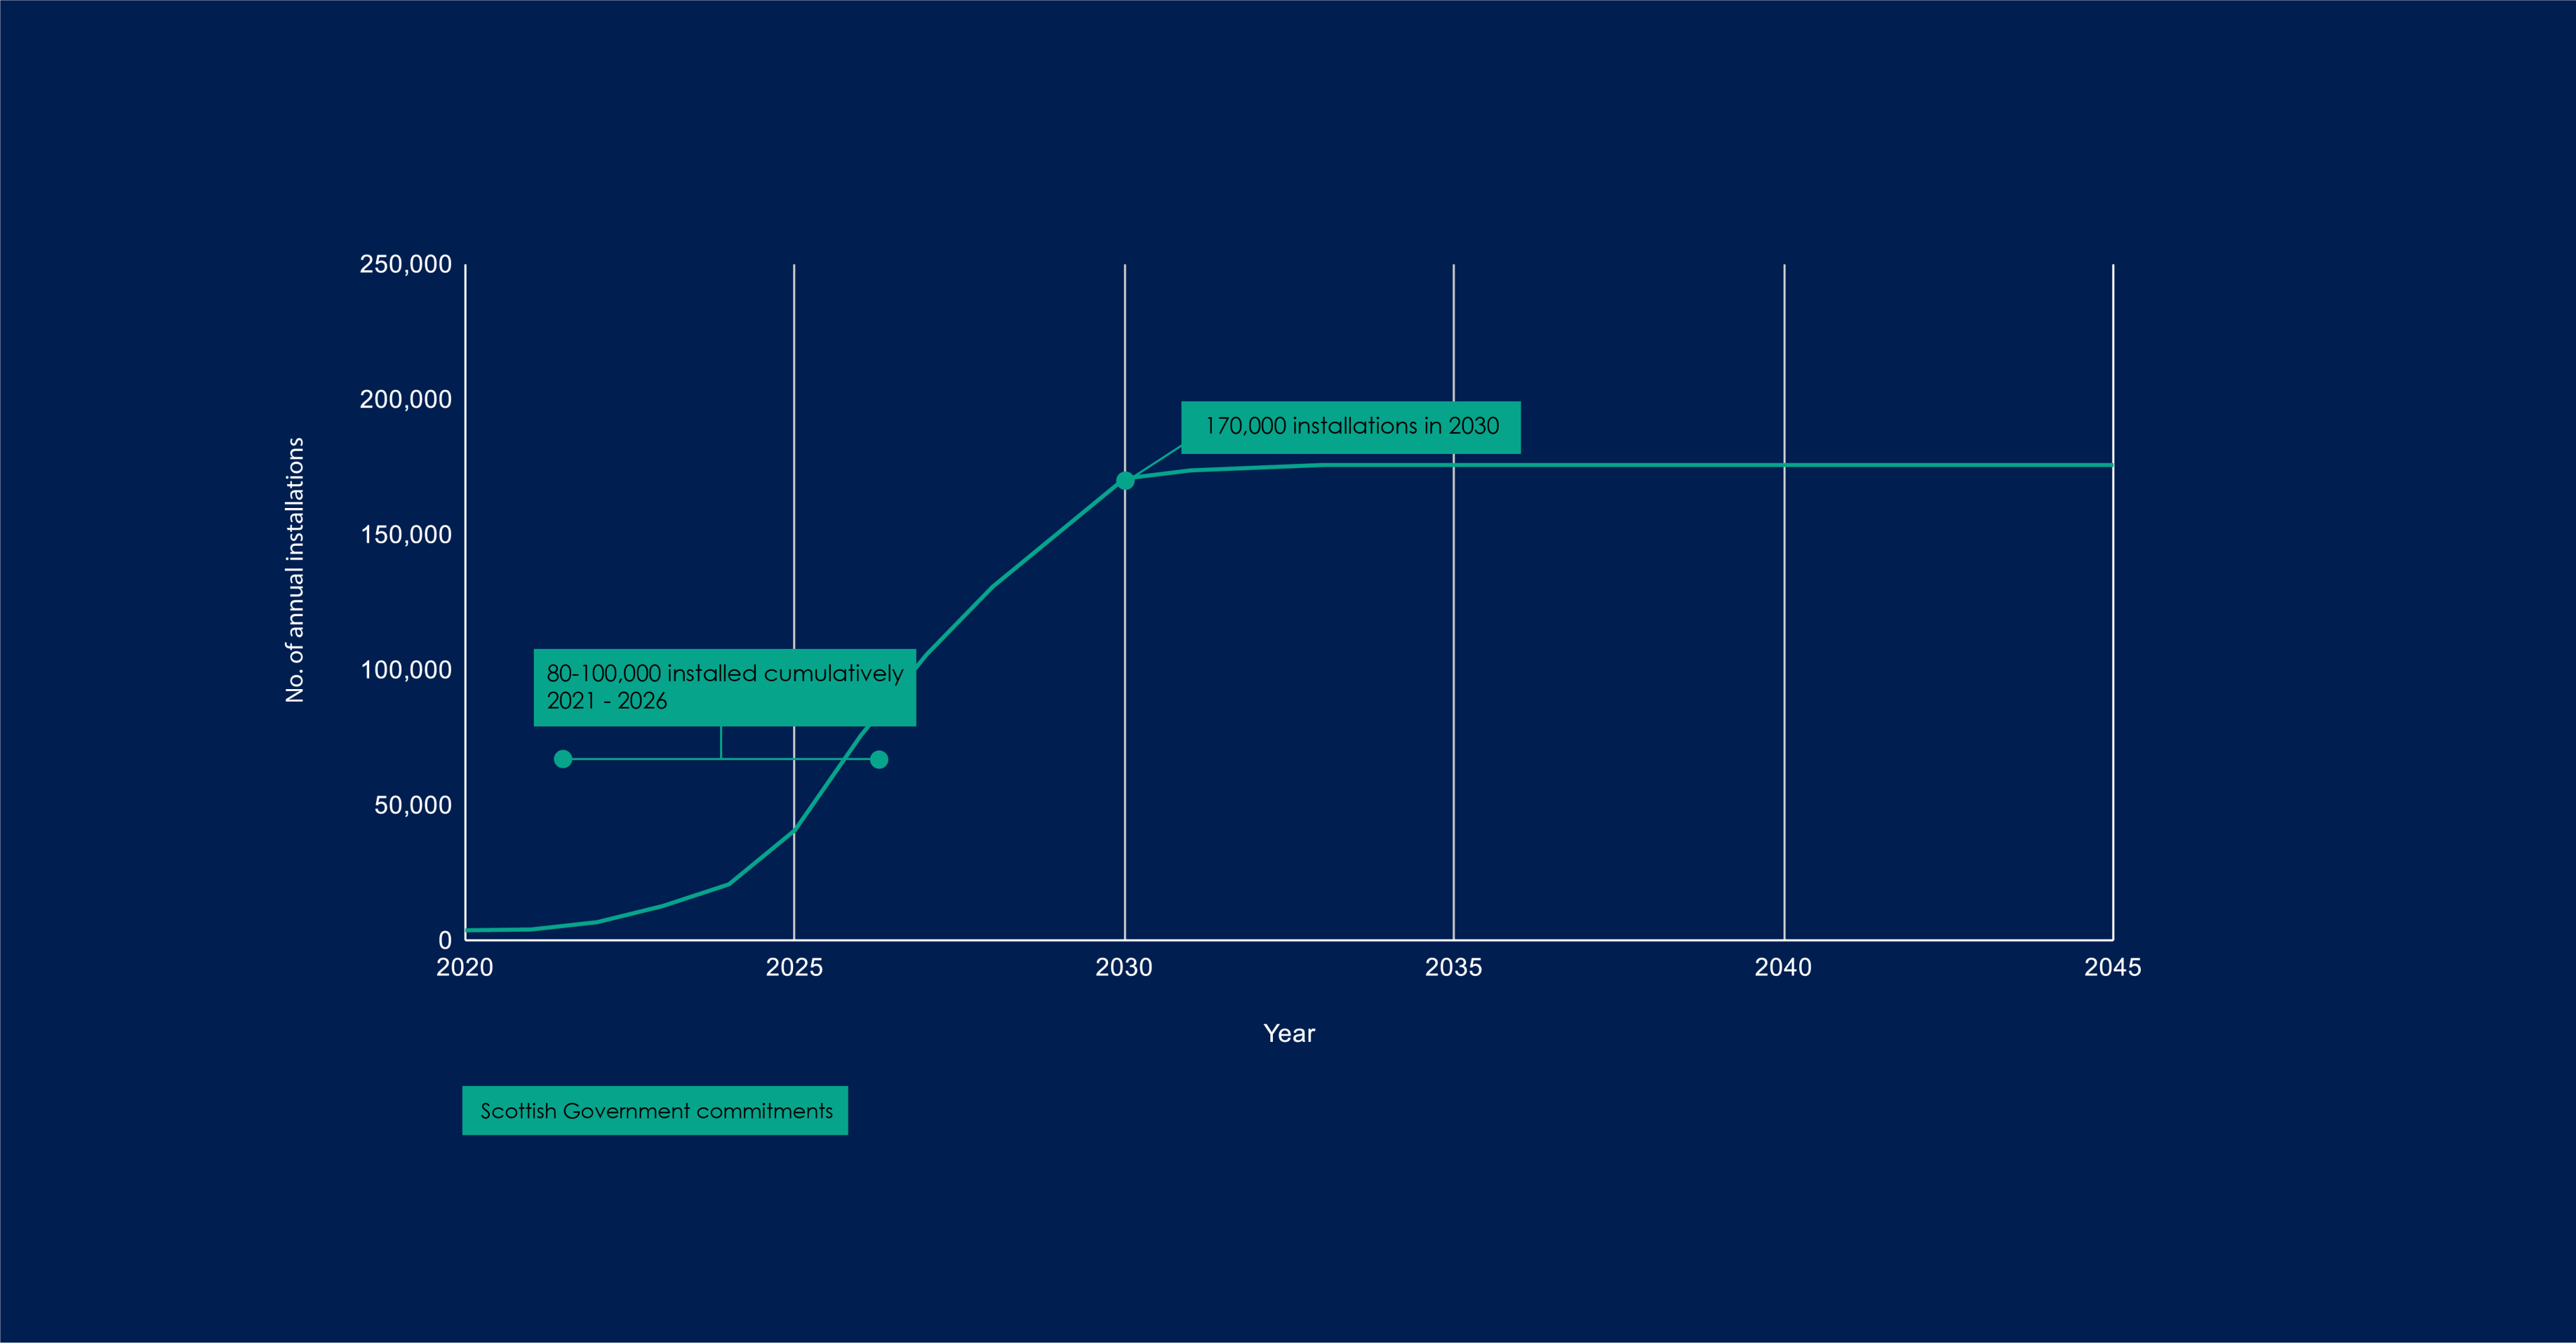


The Scottish Government's pathway is very aggressive
The Scottish Government has to base their model on reaching net zero by 2045 and hit their intermediate targets along the way, regardless if that is the optimum way. Their target of 170,000 installations per year is well above the maximum replacement cycle, would require year on year growth of 30,000 installations per year for five straight years and is also more replacements than the proposed regulations require.
CCC’s pathway doesn’t get there fast enough
The CCC states that their pathway assumes “some households will be met by low-carbon heat networks” so they have much lower overall target figures. However, heat networks are slower to scale-up and respond to regulatory changes as they take longer to plan, finance, approve and install. To meet the proposed regulations we still need to really speed up deployment of heat pumps.
Regulations
Using the regulatory proposals as a guide gives us an interesting pathway that is based on the number of properties that are directly affected by the regulations. However, plotting a regulation-driven pathway assumes that households will install a heat pump or low carbon heating the moment the regulation comes into force.
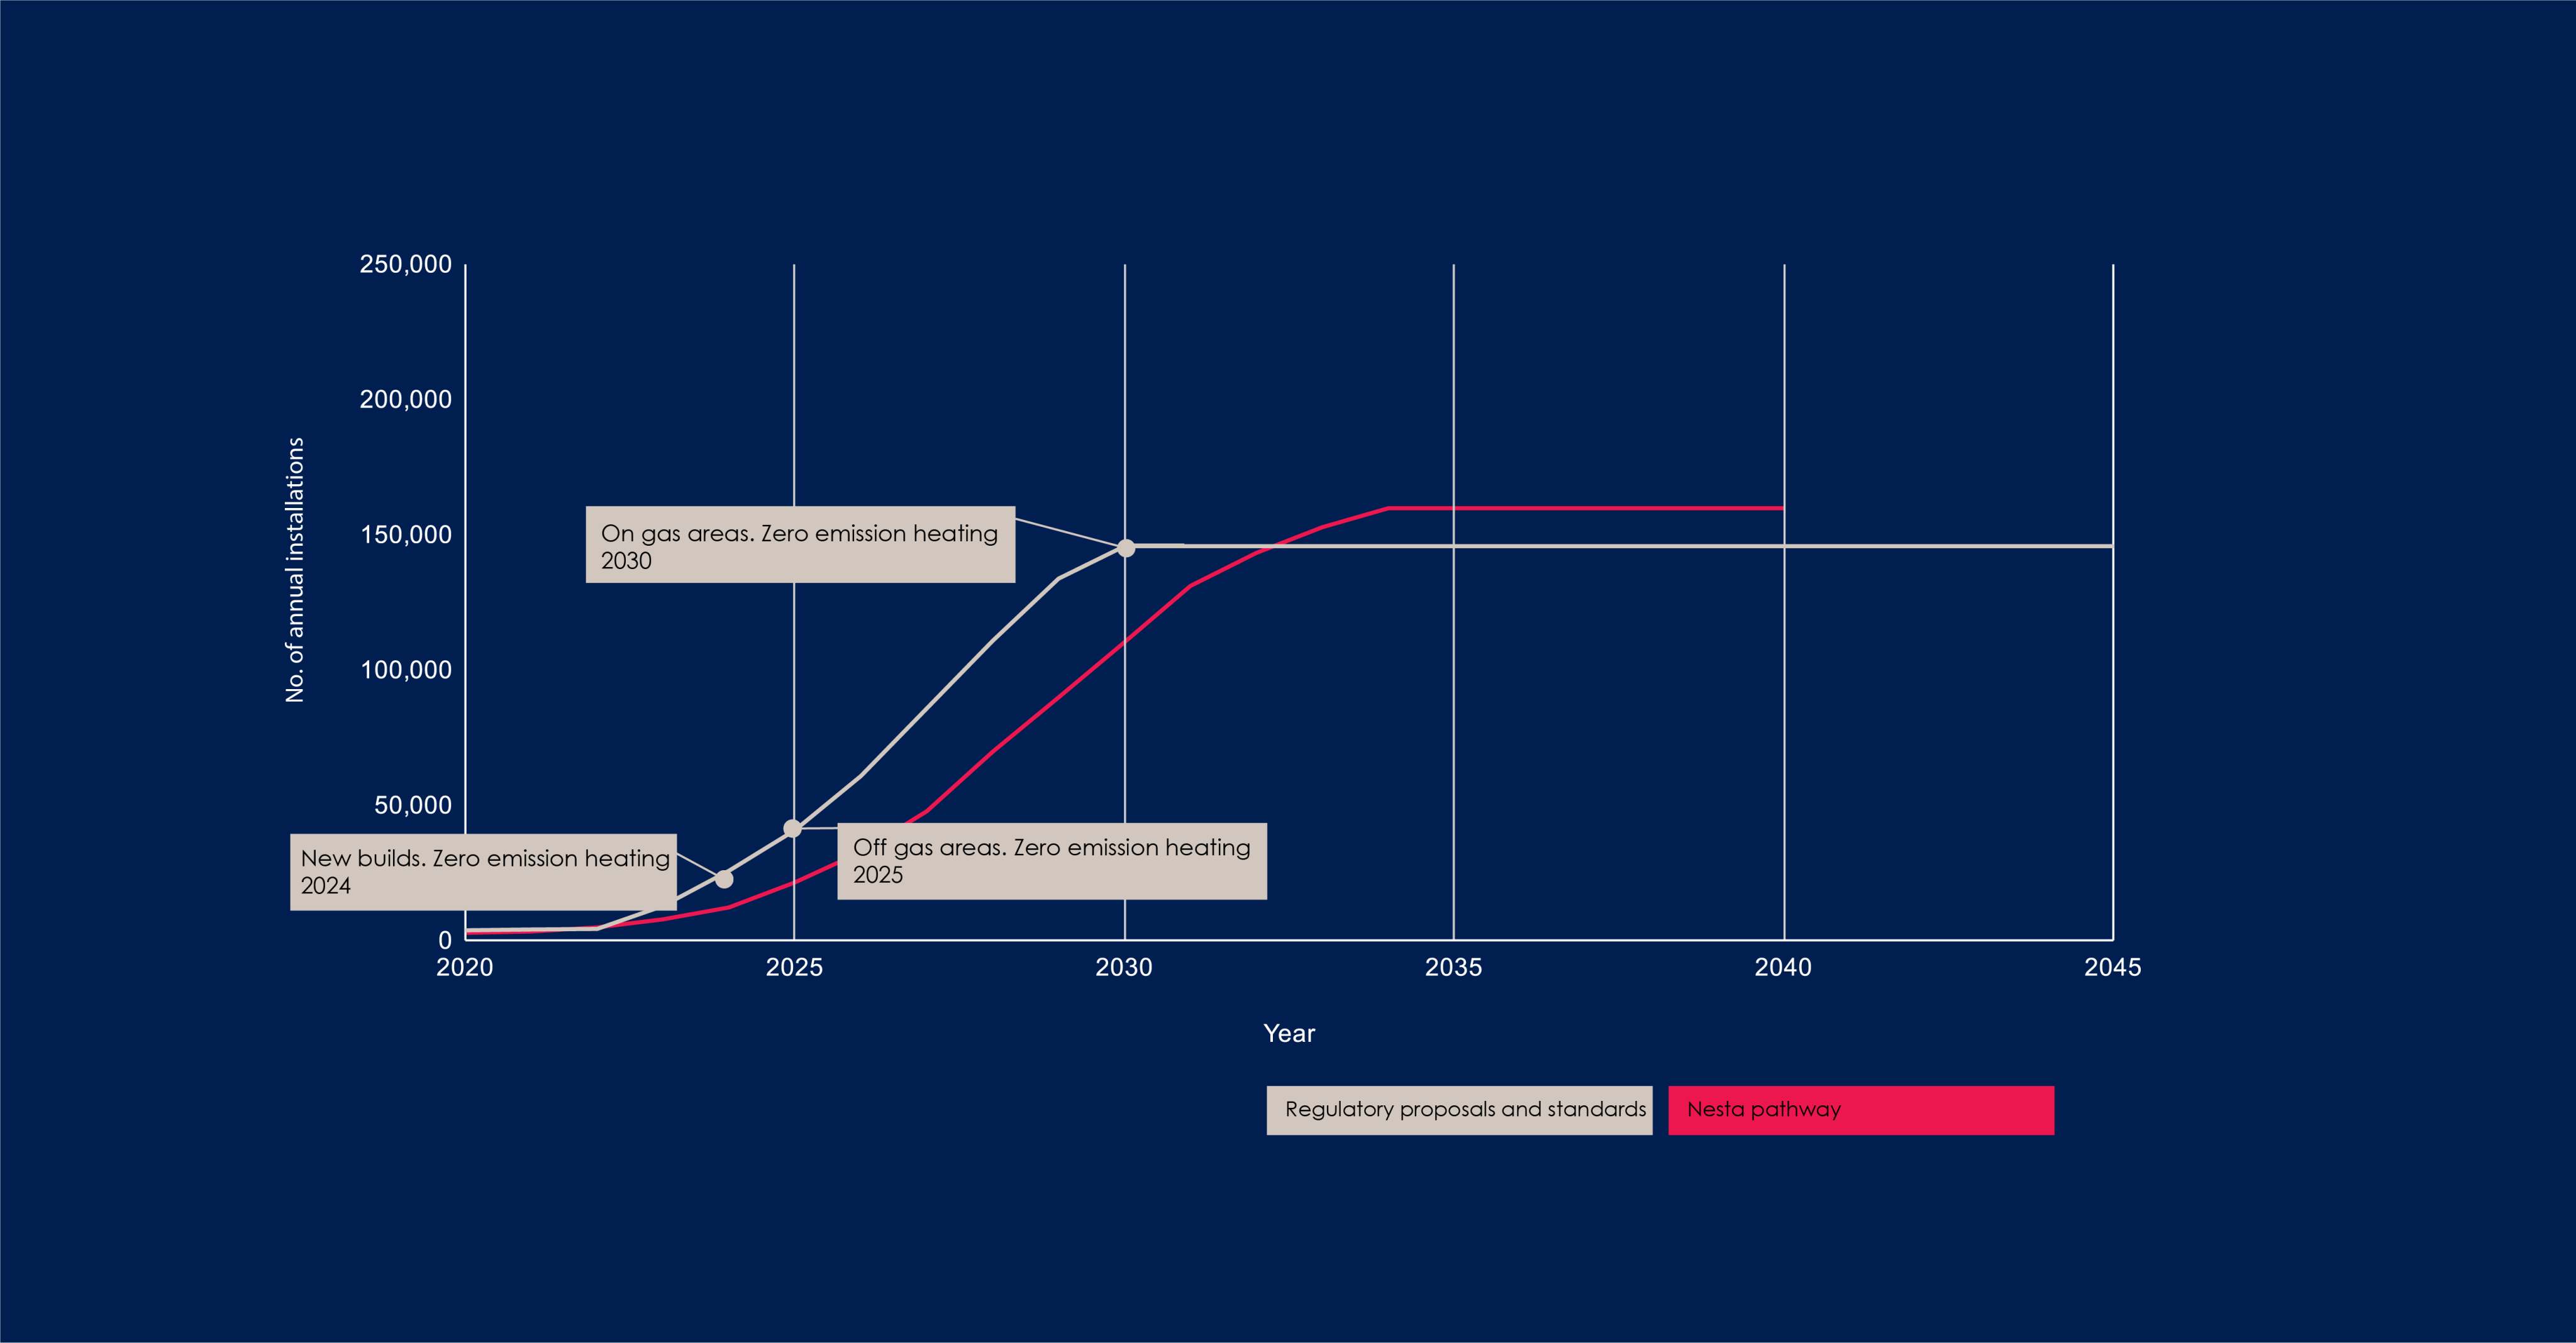
Proposing a fourth pathway that follows the trajectory plotted by the regulatory proposals but assumes that we will experience some lag as supply takes time to meet demand. This lag is around three years and peaks at 160,000 installations a year, enough to cover every reasonable new build installation and fossil fuel replacement installation.
Using the fourth pathway – informed by the proposed regulations – let’s look at how the proposed regulations will affect how heat pumps will be installed in different properties over the coming years.
2023
Modest, organic growth in heat pump installations. Predominantly replacing oil boilers, increases in gas replacements and a growing number of new builds.
2024
The proposed regulations for new builds comes into effect causing the number of heat pumps to grow from 7,800 to 12,300. Construction firms upskill their existing installers quickly to cover this demand, but pressure on the supply chain might mean that only half of the 20,000+ new build properties are fitted with heat pumps.
The knock-on effect could be that it becomes more difficult to find an installer to fit heat pumps as a replacement for oil or gas boilers and the numbers drop slightly.
2025
The proposed regulations phasing out fossil fuels in off gas areas come into effect and cause a dual pressure on supply as new build numbers are still rising and have not reached full coverage.
Total heat pump installs are at 21,950 – almost ten times the numbers in 2020 and the industry is in full transition phase.
2028
By 2028, we have reach full coverage for heat pumps in new build homes and for oil replacements.
Since 2026, there has been enough capacity in the workforce for heat pumps to replace gas boilers too and, with regulations on the horizon in 2030, gas installers are preparing by retraining and pivoting their businesses to cover both heat pumps and gas boilers.
2030
The proposed regulations for 2030 are that there are no new fossil fuels in on gas areas.
However, the gas boiler replacement rate in Scotland is currently around 110,000 per year. Total heat pumps installed in 2030 is 113,000.
But with new builds, oil replacements and small numbers of LPG and Electric replacements, it is possible that around 70,000 gas boilers are replaced with heat pumps in 2030.
A huge increase in eight years.
By 2033, three years after the proposed regulation of gas boilers, heat pumps are now covering every reasonable installation, peaking at nearly 160,000 installations per year.
By 2037, oil boilers have been completely phased out meaning that the overall number of heat pump installations dips slightly. Non-regulated but less efficient heating systems, such as direct electric and storage heaters, may see a rise in heat pump replacements.
By 2045, we are now 20 years on from the initial boom in heat pump installations and some of those heat pumps need replaced on top of the remaining gas replacements. These replacements should be easier and quicker than a retrofit, but could cause a second peak – if we have not completed the gas to heat pump transition by this point.
This model has been constructed based on the targets and proposed regulations. It is not predictive of the future – but it serves to surface issues that can be foreseen in the supply of heat pumps at the scale we have identified is necessary.
Looking from here, the task of decarbonising Scotland’s homes seems extremely daunting. And 160,000 heat pump installations a year from our current position of around 2,500 a year sounds fanciful.
However, the current number of installs of gas, oil, electric and new build heating systems amounts to around 150,000 a year.
We do not need a completely new workforce, sales funnels or supply chains – we need a transition over from fossil fuels to highly efficient heat pumps.
That will mean a change in rhetoric and attitude and a willingness to approach the topic of heating our homes in a new way. We all need to be willing to break our relationship with volatile, polluting fossil fuels and engage more with the future of home heating.
Decision makers and policy makers need to be bold and provide the right financial support so that decarbonisation is something every home can manage. And local skills providers need to deliver high-quality training so the workforce is ready to respond to changing demand.
Most of all, we need strategic and localised transition plans to achieve net zero homes.
One model, developed by Energy Systems Catapult, is Local Area Energy Planning which helps inform and support local authorities, distribution network operators, business and communities to plan for a cost-effective low carbon transition. This is important as grid operators need to be able to make informed decisions, based on anticipated local profiles, to bolster their networks as the heat that is currently delivered via gas pipes will be transferred onto the electricity grid.
As we have shown, the growth in demand is unlikely to be uniform across the country but will accelerate and stabilise at dissimilar rates for different areas over the next 25 years.
Up to this point, much of the talk around decarbonising home heating (including from me in a previous blog on ending our relationship with gas) has been focused on replacing gas boilers. It remains the case that getting Scotland off gas is essential in reaching our 2045 net zero targets. However, delivering a prioritised and staged transition that supports the supply chain and workforce in the right places to decarbonise the right homes at the right time, may be the most practical and optimum way to do it.
Projects such as the Sustainable Energy Supply Chain Programme and the Energy Skills Partnership are actively addressing the skills challenge, supporting the industry and providing the routes to upskill and reskill existing workers as well as bringing newly skilled workers into the industry.
Being able to anticipate local demand and work with regional partners to support and accelerate local supply will help to address the skills challenges and create a market capable of decarbonising our homes in line with our ambitious targets.
Nesta will be publishing a UK-wide overview of how we can scale up the heat pump industry quickly enough to keep pace with demand.
At Nesta, we would like to take this work forward with local authorities, regional skills providers and industry bodies to identify the necessary workforce and the requisite skills needed to decarbonise the local housing stock.
If you would like to discuss this work, or where it goes next, please contact Kyle.usher@nesta.org.uk
This Shorthand is part of our policy library for decarbonising home heating.