How should policy define healthy food? The case for the nutrient profile model


How should policy define healthy food? The case for the nutrient profile model
By Lauren Bowes Byatt and Thomas Bunting


In the UK, around two-thirds of people are living with excess weight and obesity. The government and the food industry share a responsibility to make the healthier choice for all - not just those with the capacity to navigate an evolving landscape of health definitions and information.
Policies that reshape our food environment - how food is promoted, marketed and displayed - are popular with the public and estimated to have a substantial impact on obesity prevalence. The recently announced healthy food standard aims to turn this ambition into action by introducing mandatory reporting and health targets across the food sector.
But for any of this to work, we need an effective way to measure how healthy food actually is. At Nesta, we believe a tool already exists that is evidence-backed, legally robust and should be used to drive future food policies - the Nutrient Profile Model (NPM).
The NPM is not just a label: it’s a calculator
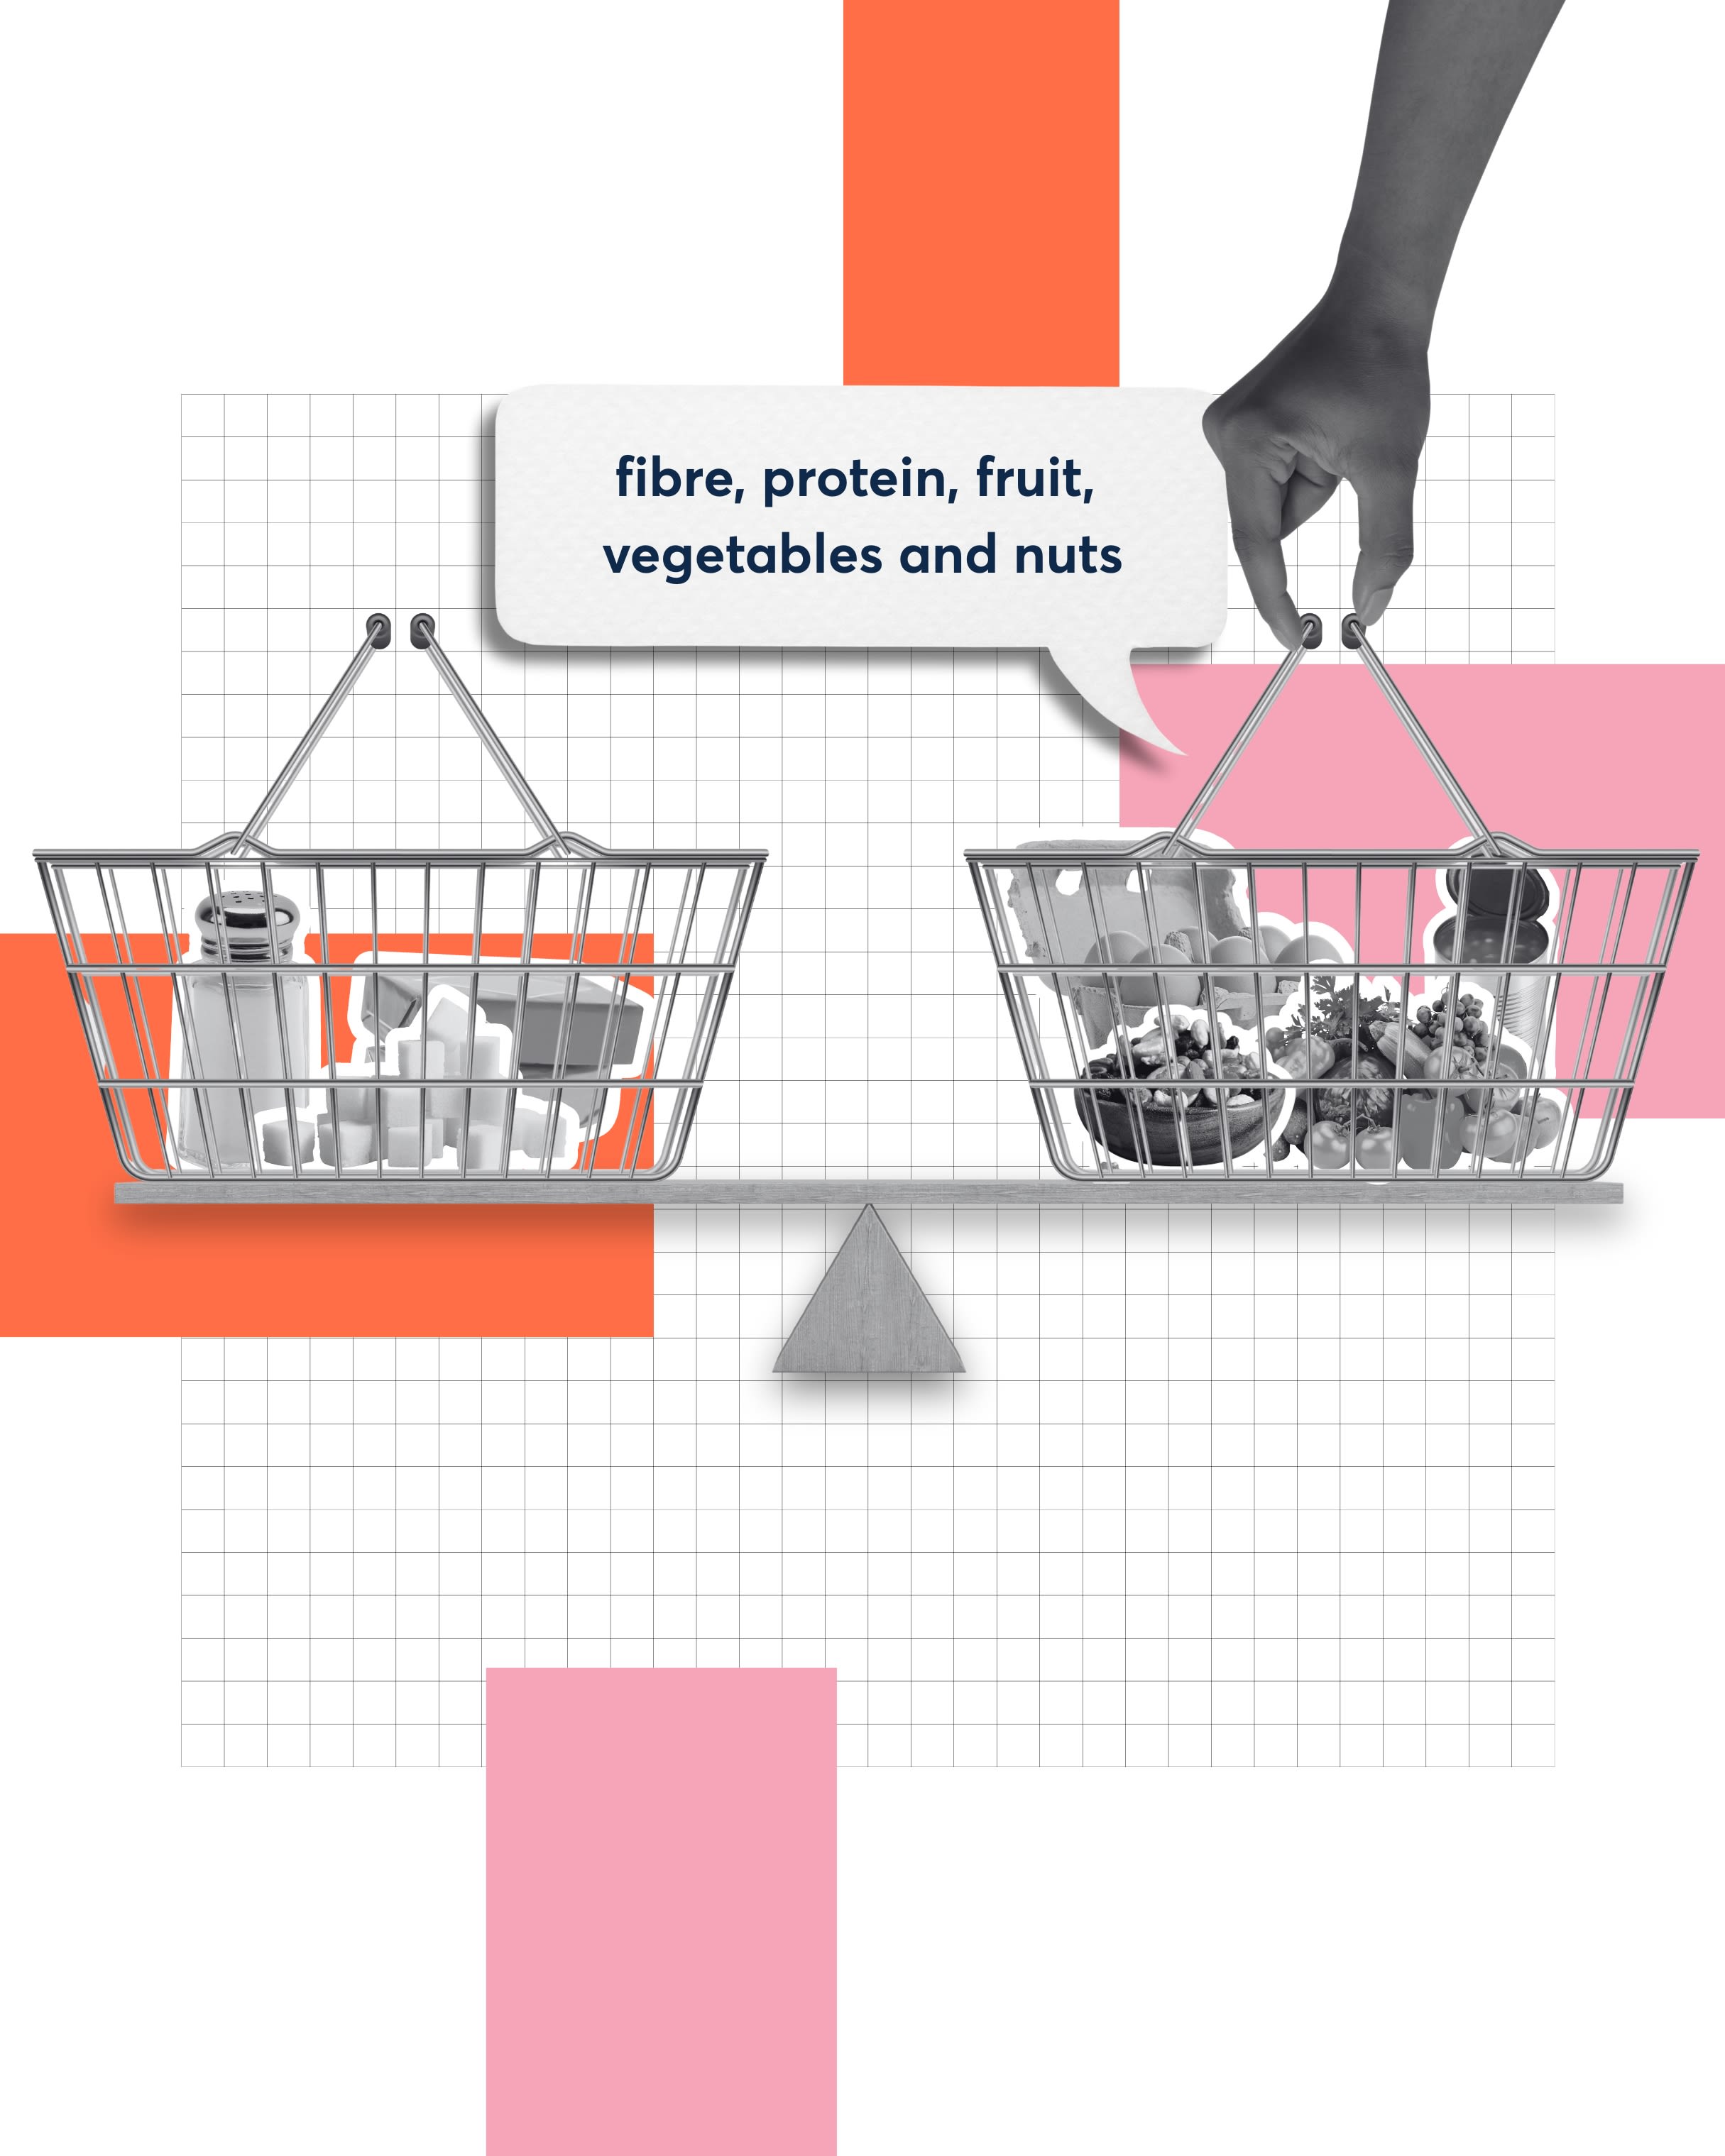
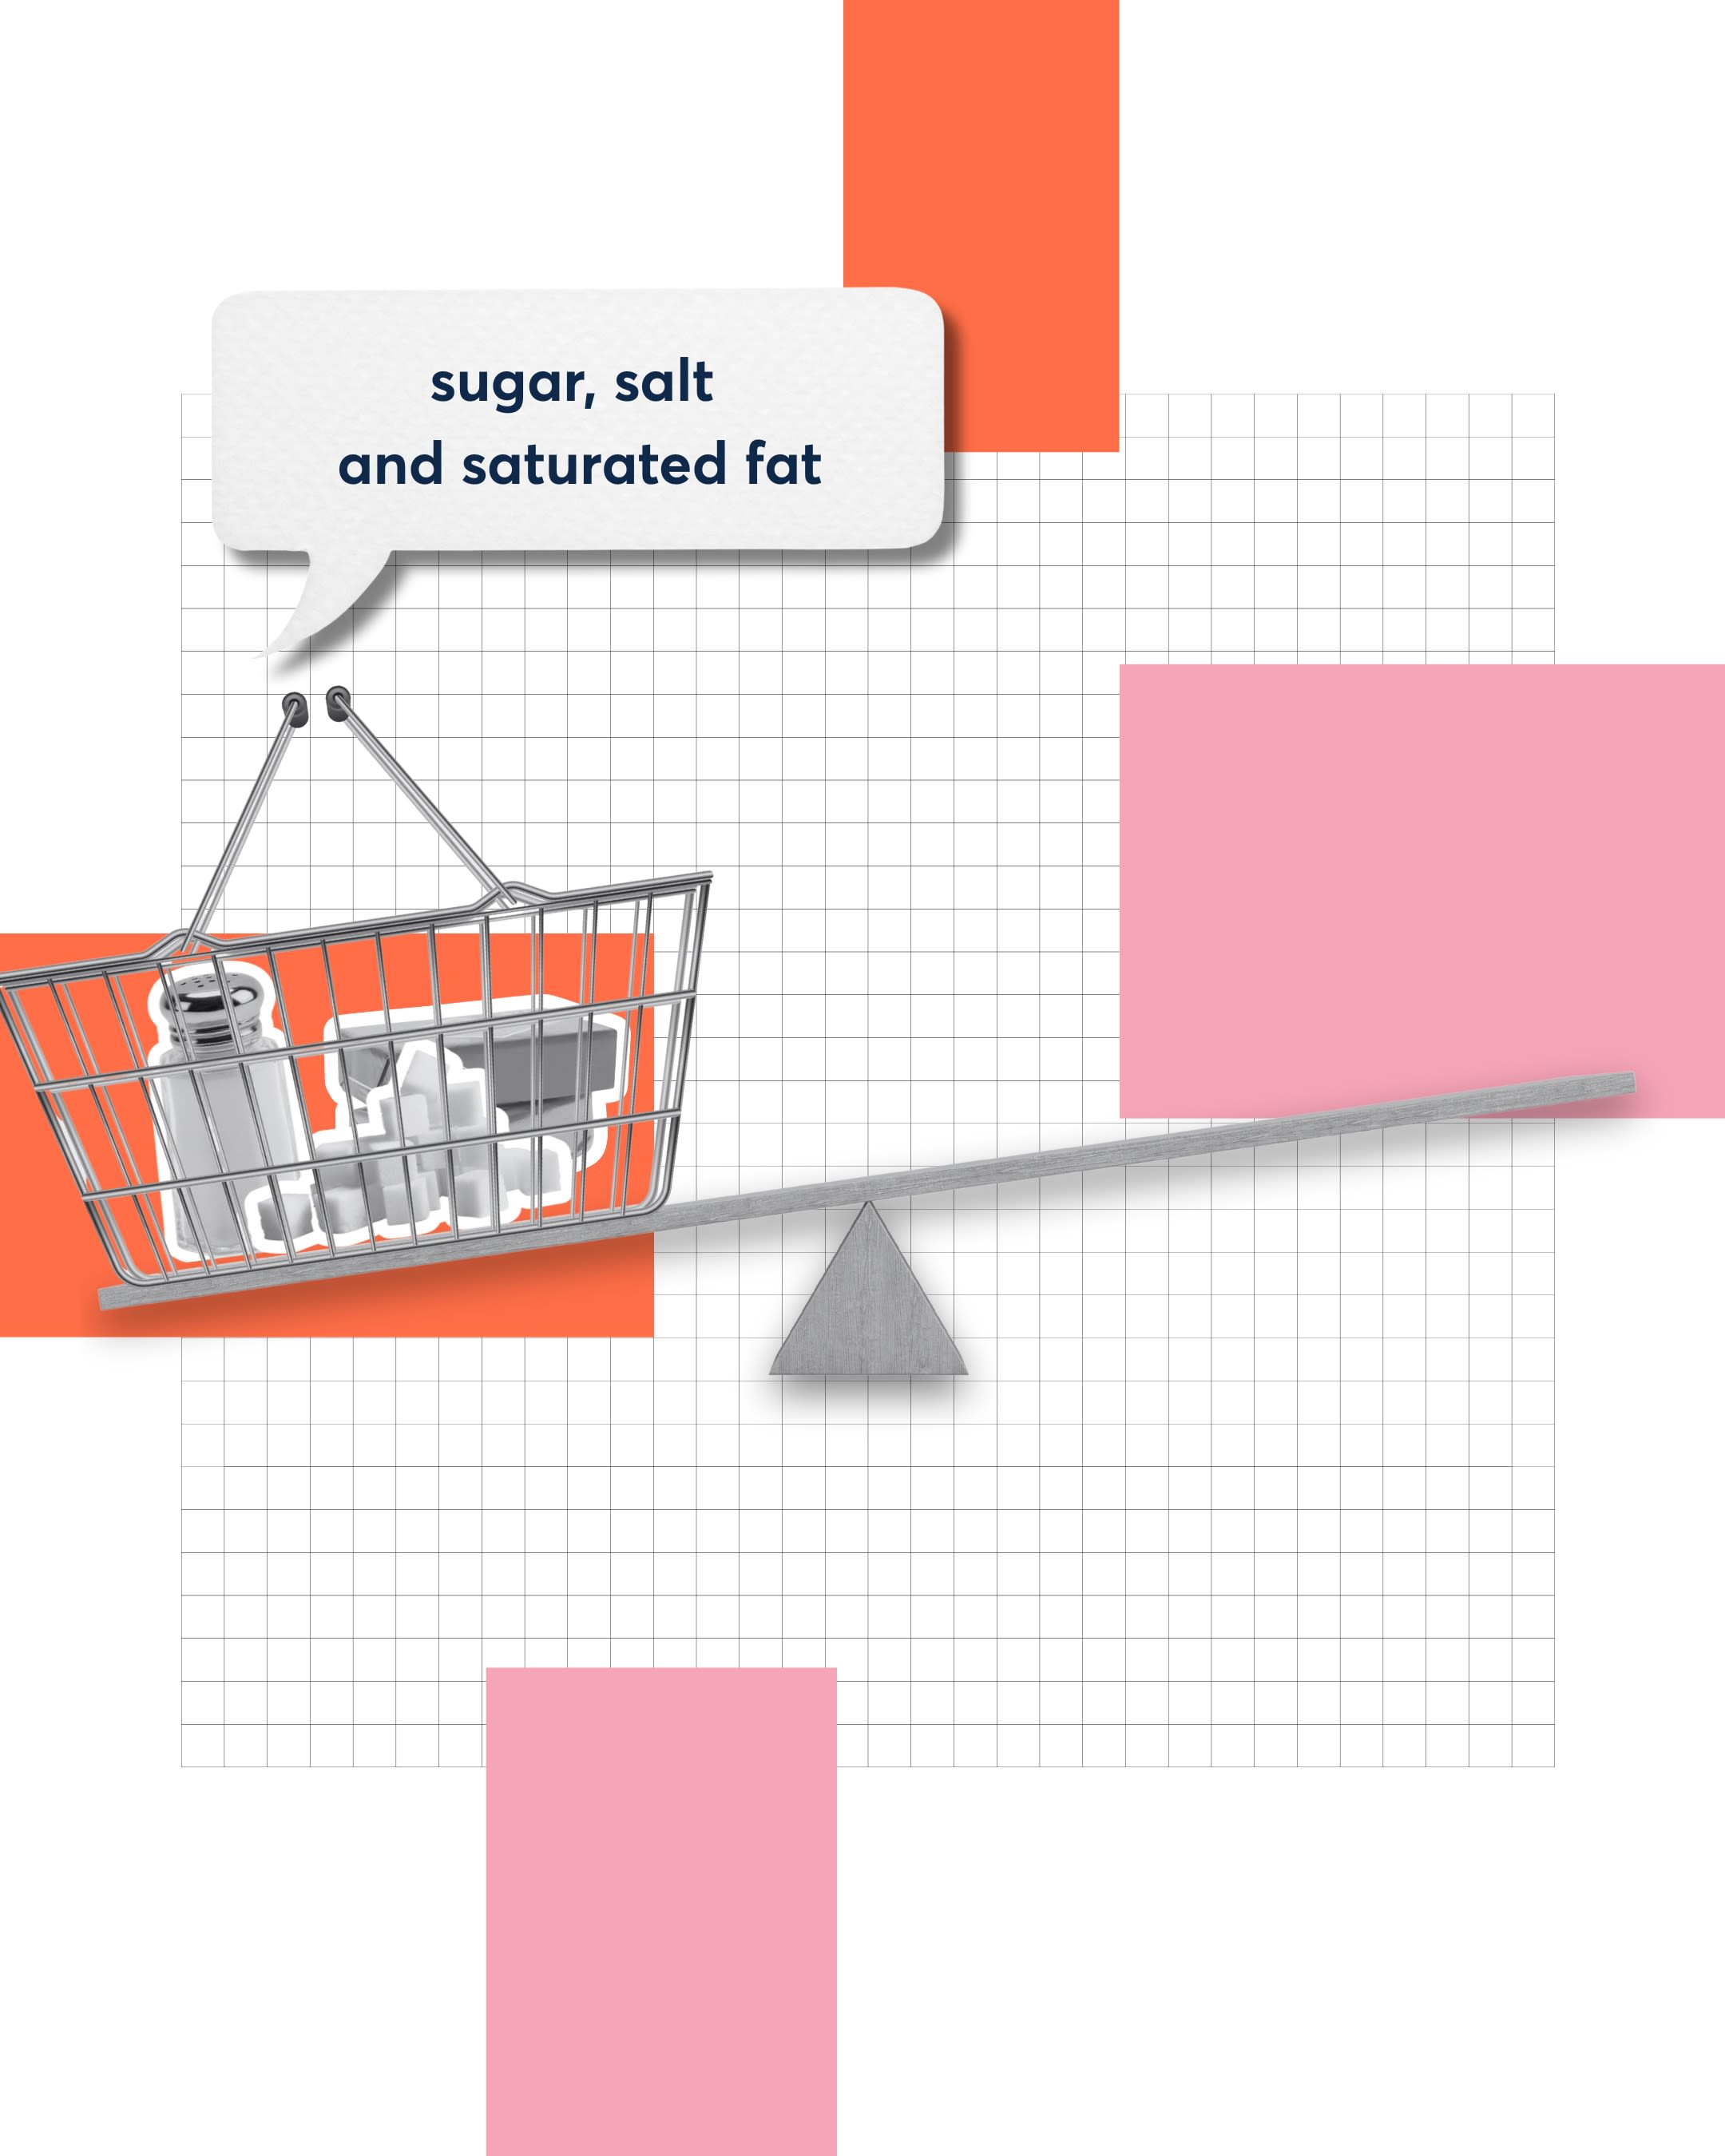
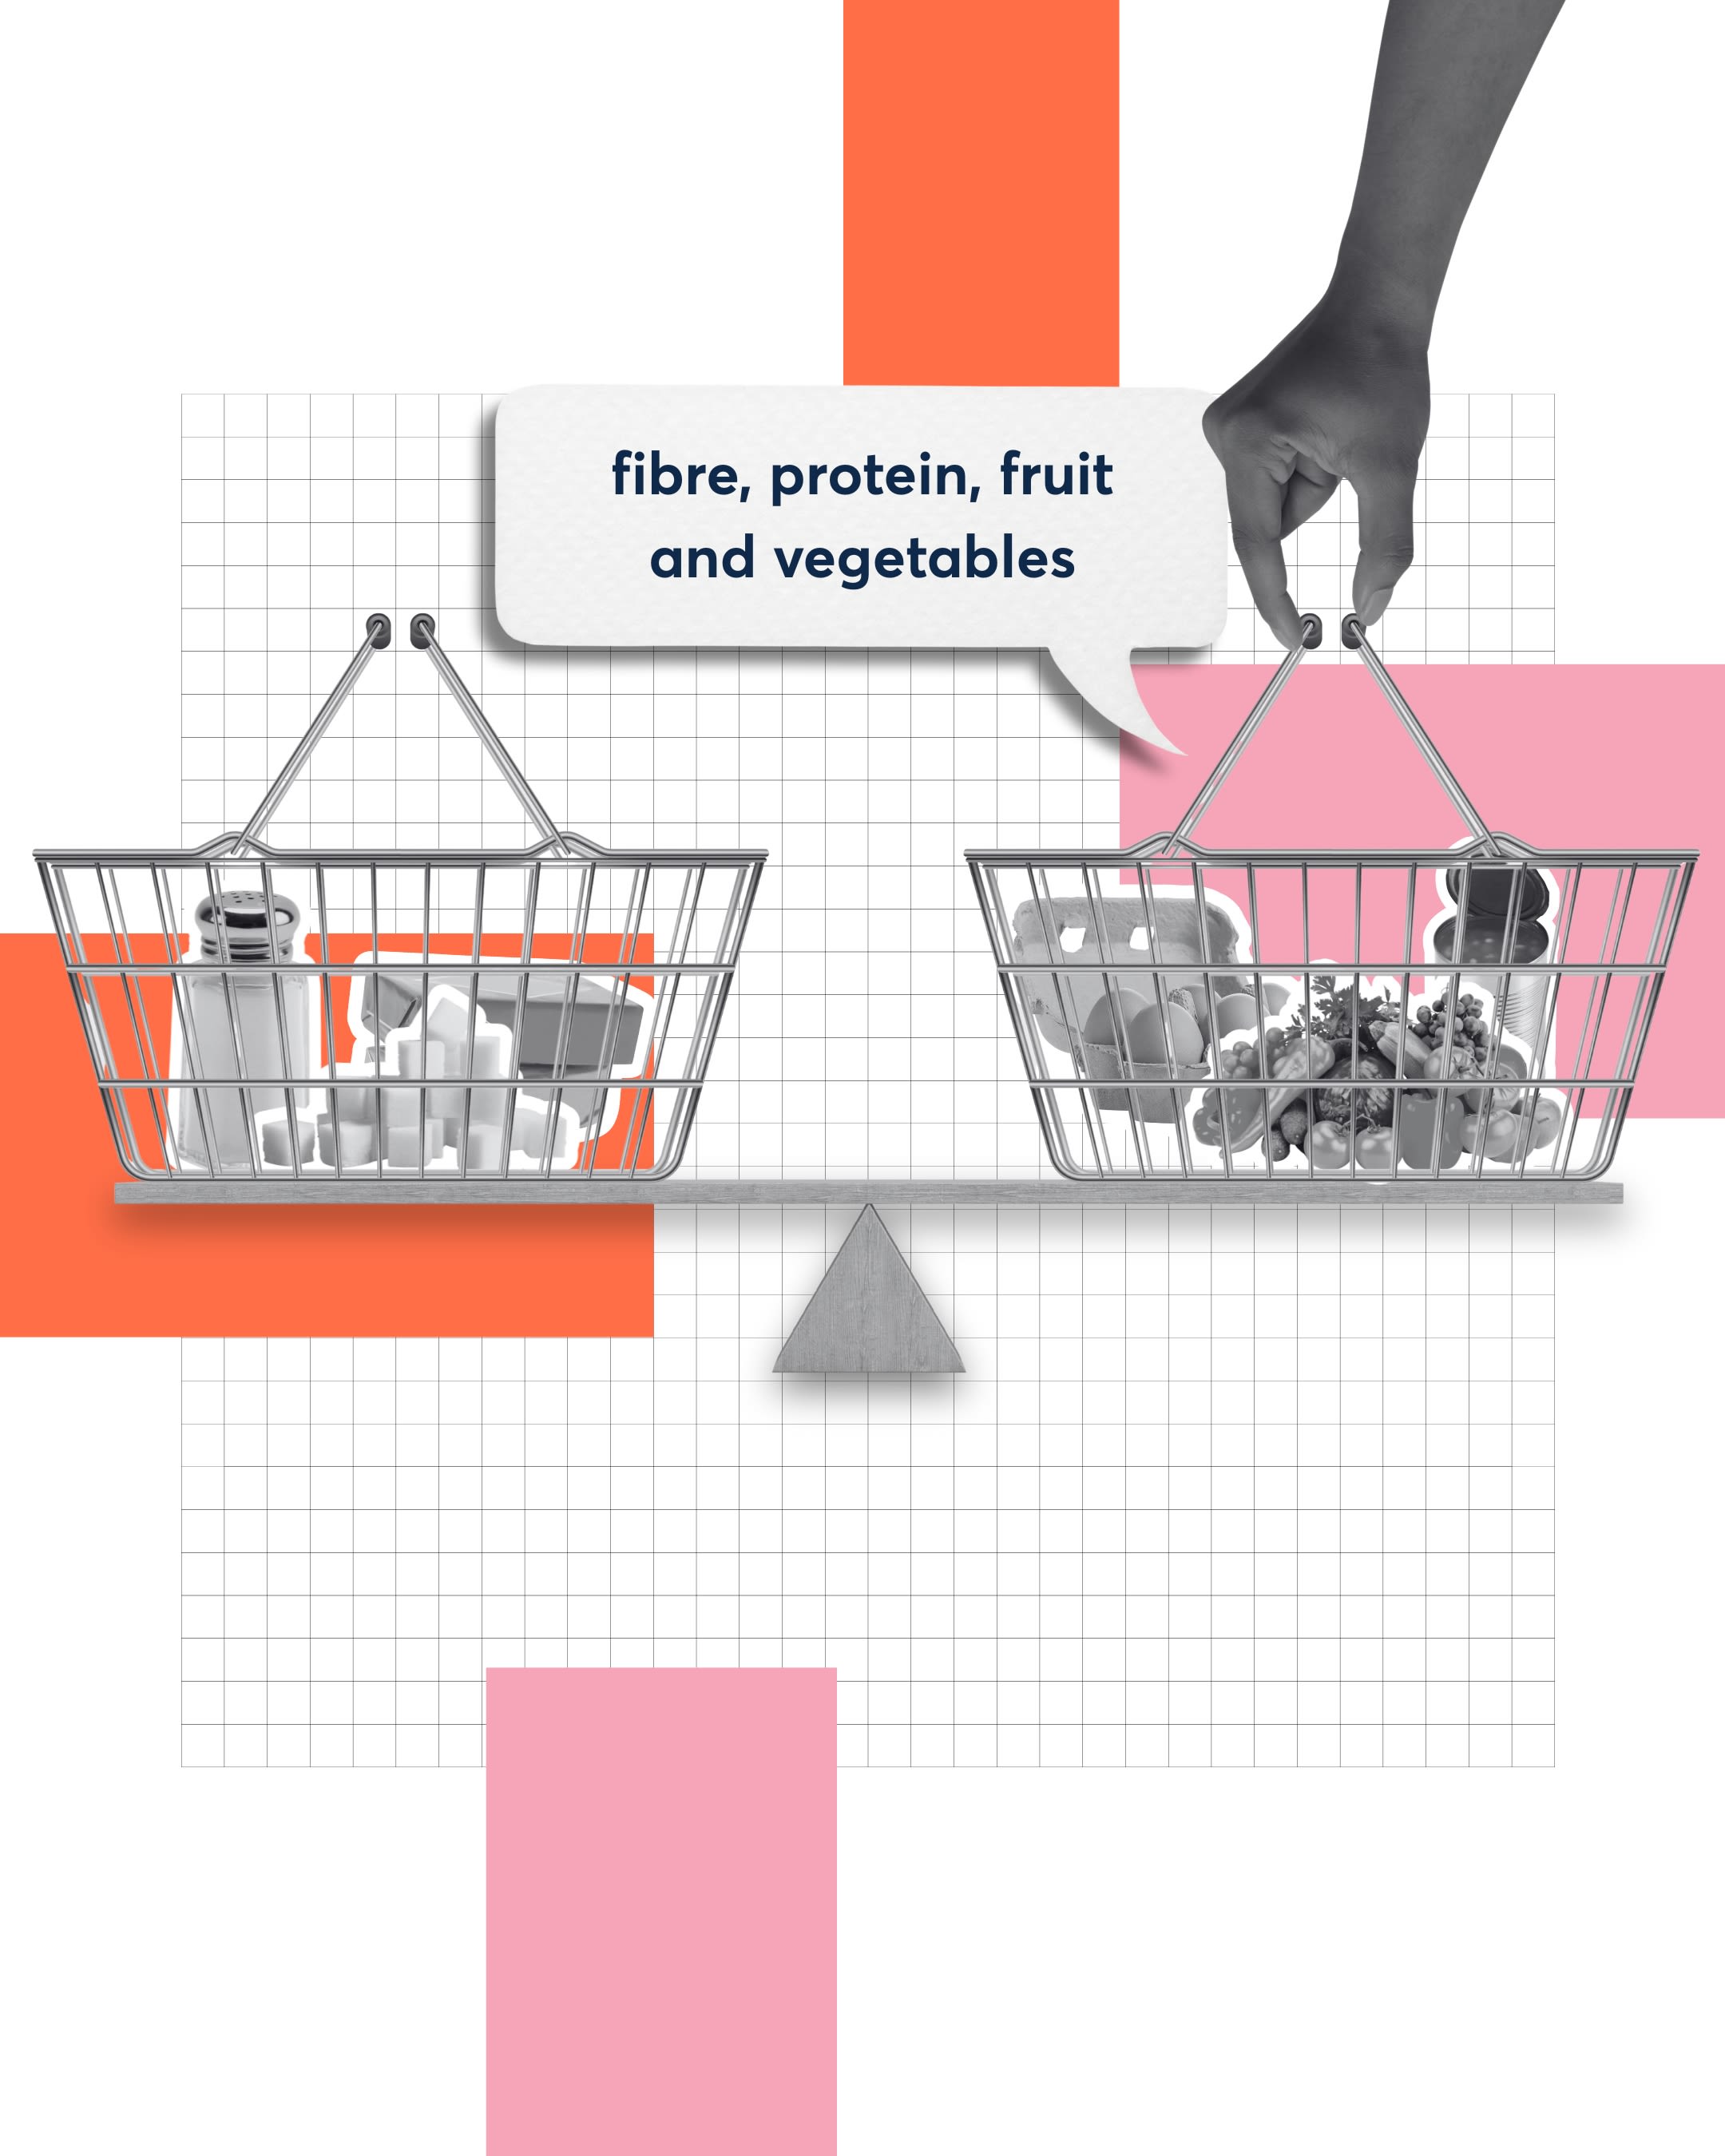
The NPM works by getting under the hood of our food. Rather than looking at one component like sugar, the NPM evaluates products based on the key nutrients they contain. It calculates a score by balancing the health ‘negatives’ (sugar, salt, saturated fat and calories), against the ‘positives’ (fibre, protein, fruit, veg and nuts). Scores range from -15 (most healthy) to +40 (least healthy). Currently, any food scoring 4 or above (or drink scoring 1 or above) is flagged as High in Fat, Salt or Sugar (HFSS) for regulatory purposes in the UK.
The original scale of the NPM is not very intuitive, so can be converted to a score of 1-100 using a method developed by Oxford University. A ‘converted score’ of 1 is the least healthy, and 100 is the most healthy.


Positive nutrients subtract from the negative ones to give a final NPM score.
Positive nutrients subtract from the negative ones to give a final NPM score.
Positive nutrients subtract from the negative ones to give a final NPM score.
Positive nutrients subtract from the negative ones to give a final NPM score.


The NPM is not just a label: it’s a calculator
The NPM works by getting under the hood of our food. Rather than looking at one component like sugar, the NPM evaluates products based on the key nutrients they contain. It calculates a score by balancing the health ‘negatives’ (sugar, salt, saturated fat and calories), against the ‘positives’ (fibre, protein, fruit, veg and nuts). Scores range from -15 (most healthy) to +40 (least healthy). Currently, any food scoring 4 or above (or drink scoring 1 or above) is flagged as High in Fat, Salt or Sugar (HFSS) for regulatory purposes in the UK.
The original scale of the NPM is not very intuitive, so can be converted to a score of 1-100 using a method developed by Oxford University. A ‘converted score’ of 1 is the least healthy, and 100 is the most healthy.


No measure is perfect, but given scientific evidence and legal precedent the NPM is the best tool we have.
No measure is perfect, but given scientific evidence and legal precedent the NPM is the best tool we have.

No measure is perfect, but given scientific evidence and legal precedent the NPM is the best tool we have.
No measure is perfect, but given scientific evidence and legal precedent the NPM is the best tool we have.
Working with the NPM means we don’t need to reinvent the wheel
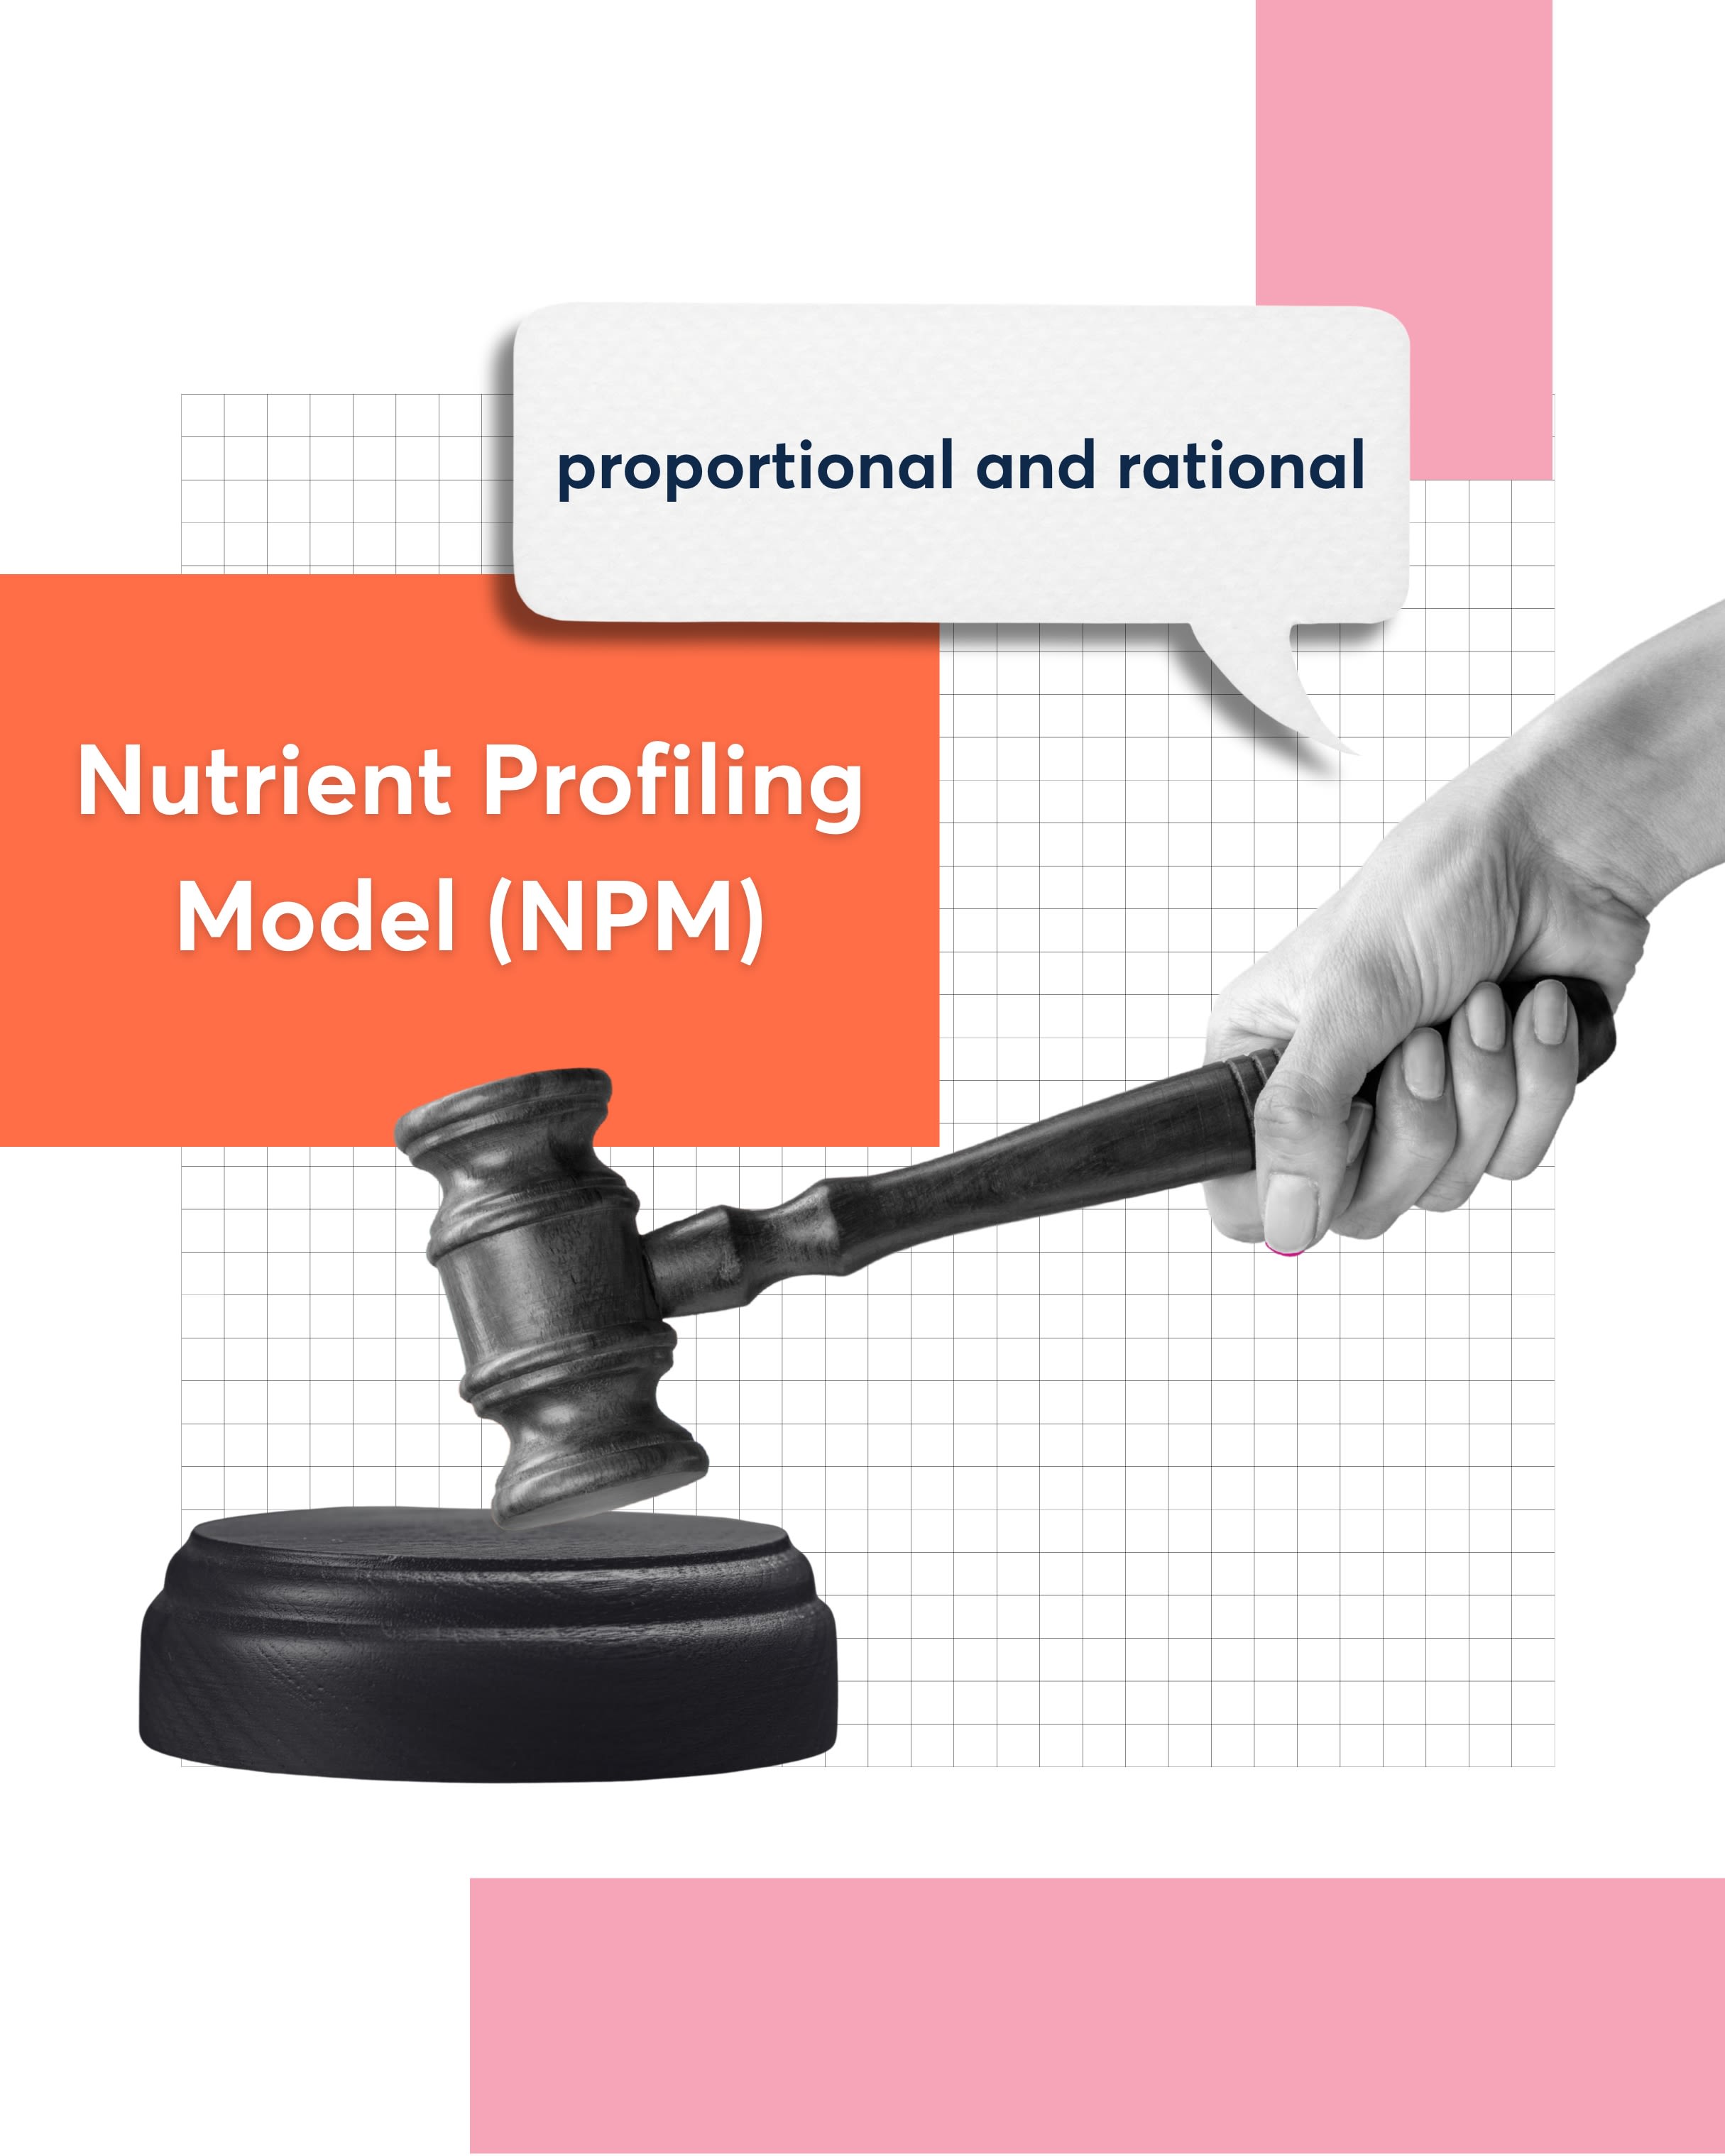
Defining ‘healthy’ is essential for any policy that restricts advertising or sets health targets. While no measure is perfect, we don’t have to start from scratch either. The NPM is already familiar to both industry and government and has the support of public health organisations. It was developed by the Food Standards Agency for regulation restricting the advertising, placement and promotion of products that are classified as HFSS (high in fat, salt or sugar). In this way, the NPM defines which products are HFSS.
In 2022, the High Court dismissed a challenge from Kellogg’s relating to the NPM, ruling that the government’s use of the model is ‘proportionate and rational’. In a policy environment where change has been slow, sticking with a tool that is used by business and has been approved by the courts is the pragmatic choice.

No measure is perfect, but given scientific evidence and legal precedent the NPM is the best tool we have.
No measure is perfect, but given scientific evidence and legal precedent the NPM is the best tool we have.
Working with the NPM means we don’t need to reinvent the wheel
Defining ‘healthy’ is essential for any policy that restricts advertising or sets health targets. While no measure is perfect, we don’t have to start from scratch either. The NPM is already familiar to both industry and government and has the support of public health organisations. It was developed by the Food Standards Agency for regulation restricting the advertising, placement and promotion of products that are classified as HFSS (high in fat, salt or sugar). In this way, the NPM defines which products are HFSS.
In 2022, the High Court dismissed a challenge from Kellogg’s relating to the NPM, ruling that the government’s use of the model is ‘proportionate and rational’. In a policy environment where change has been slow, sticking with a tool that is used by business and has been approved by the courts is the pragmatic choice.


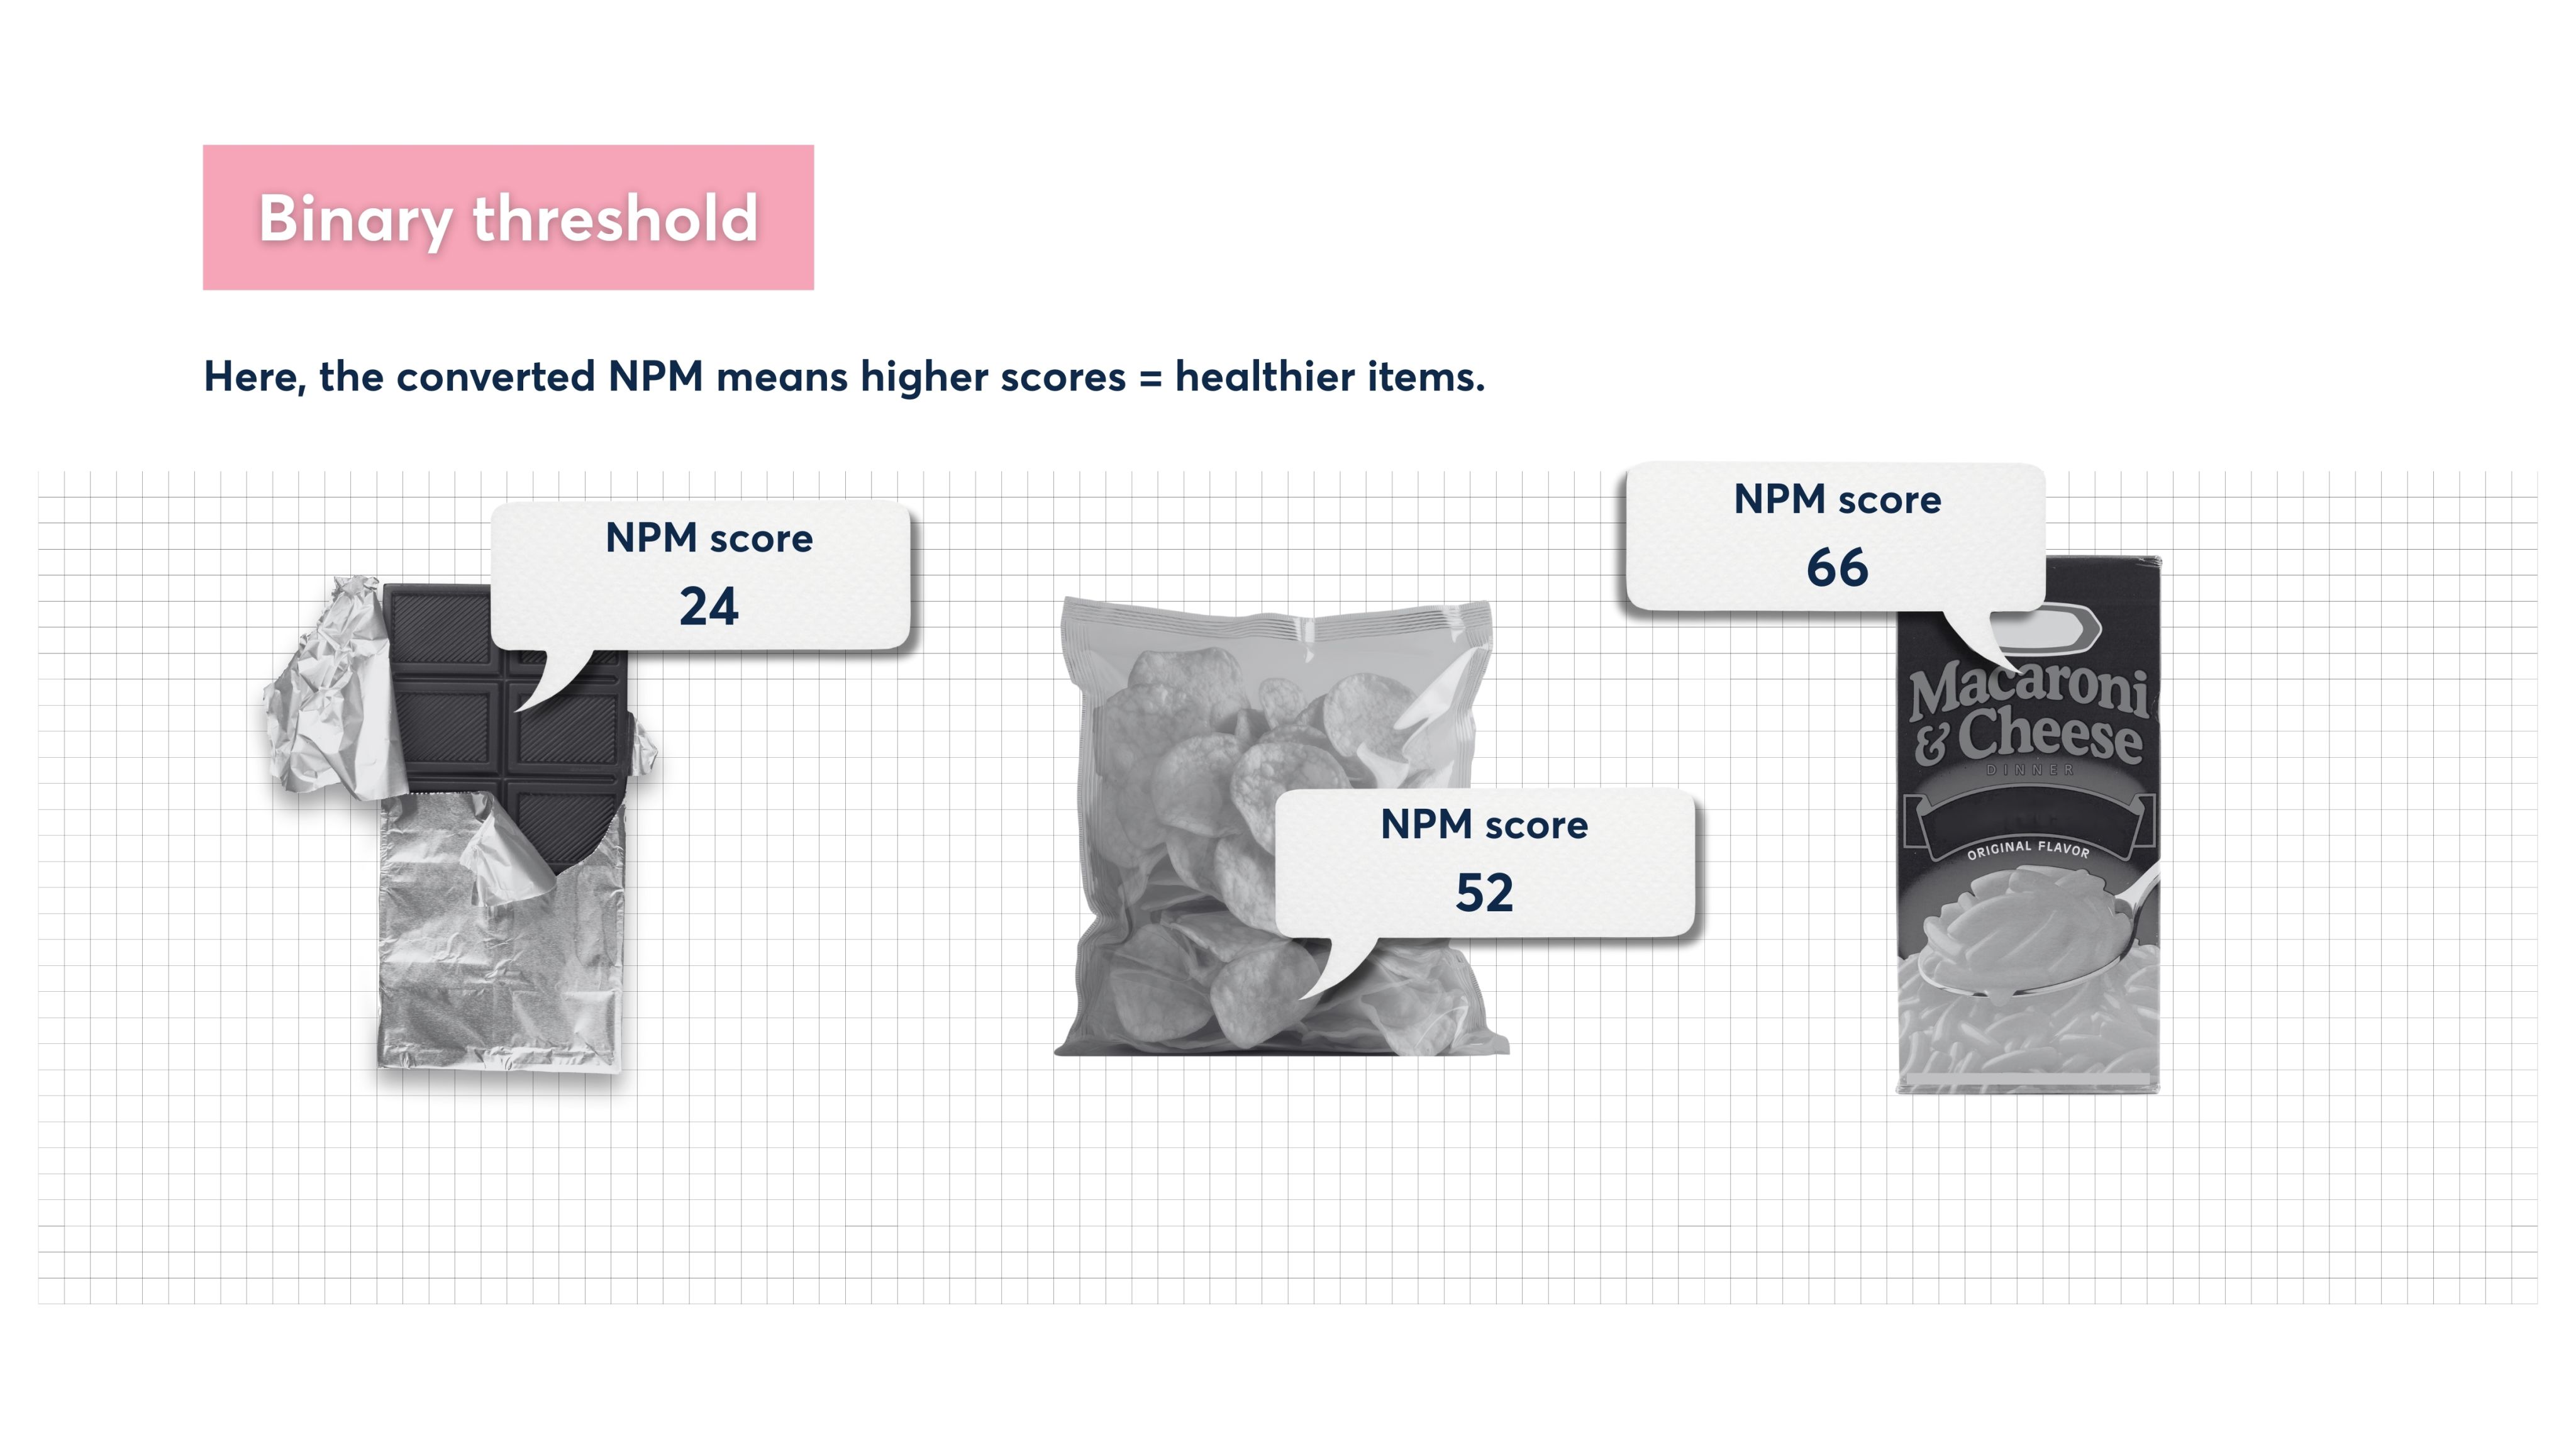


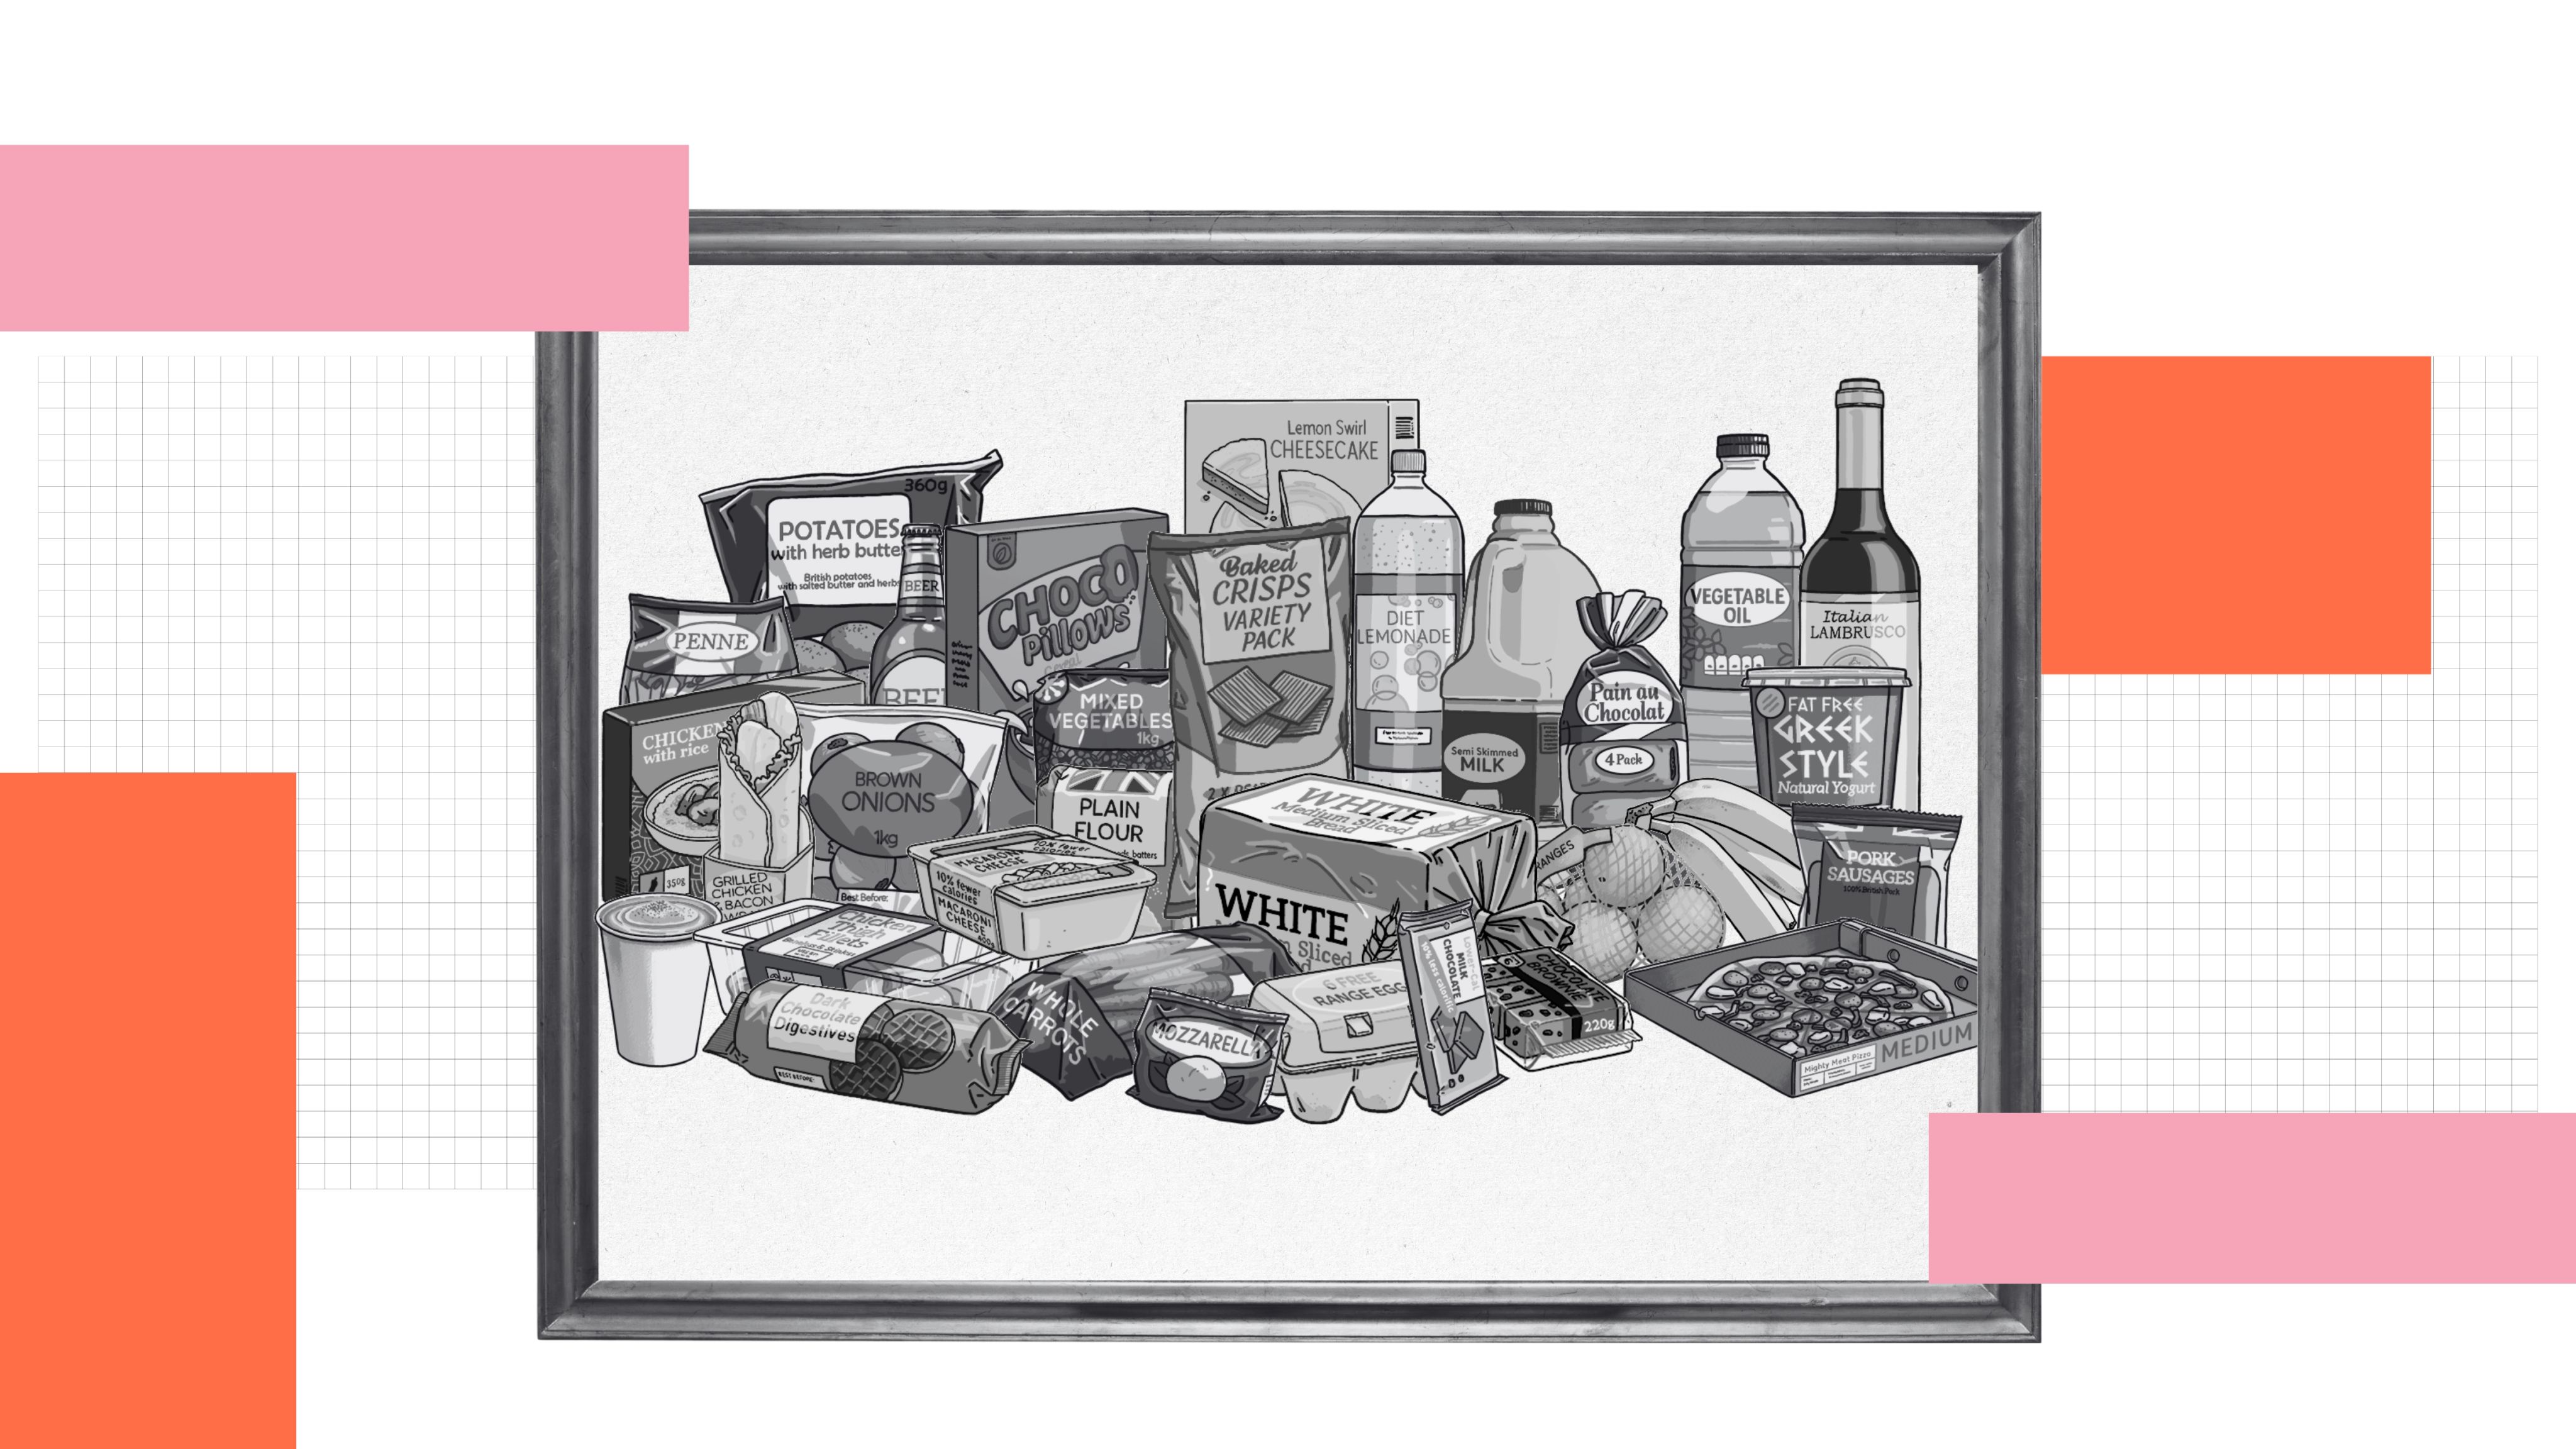
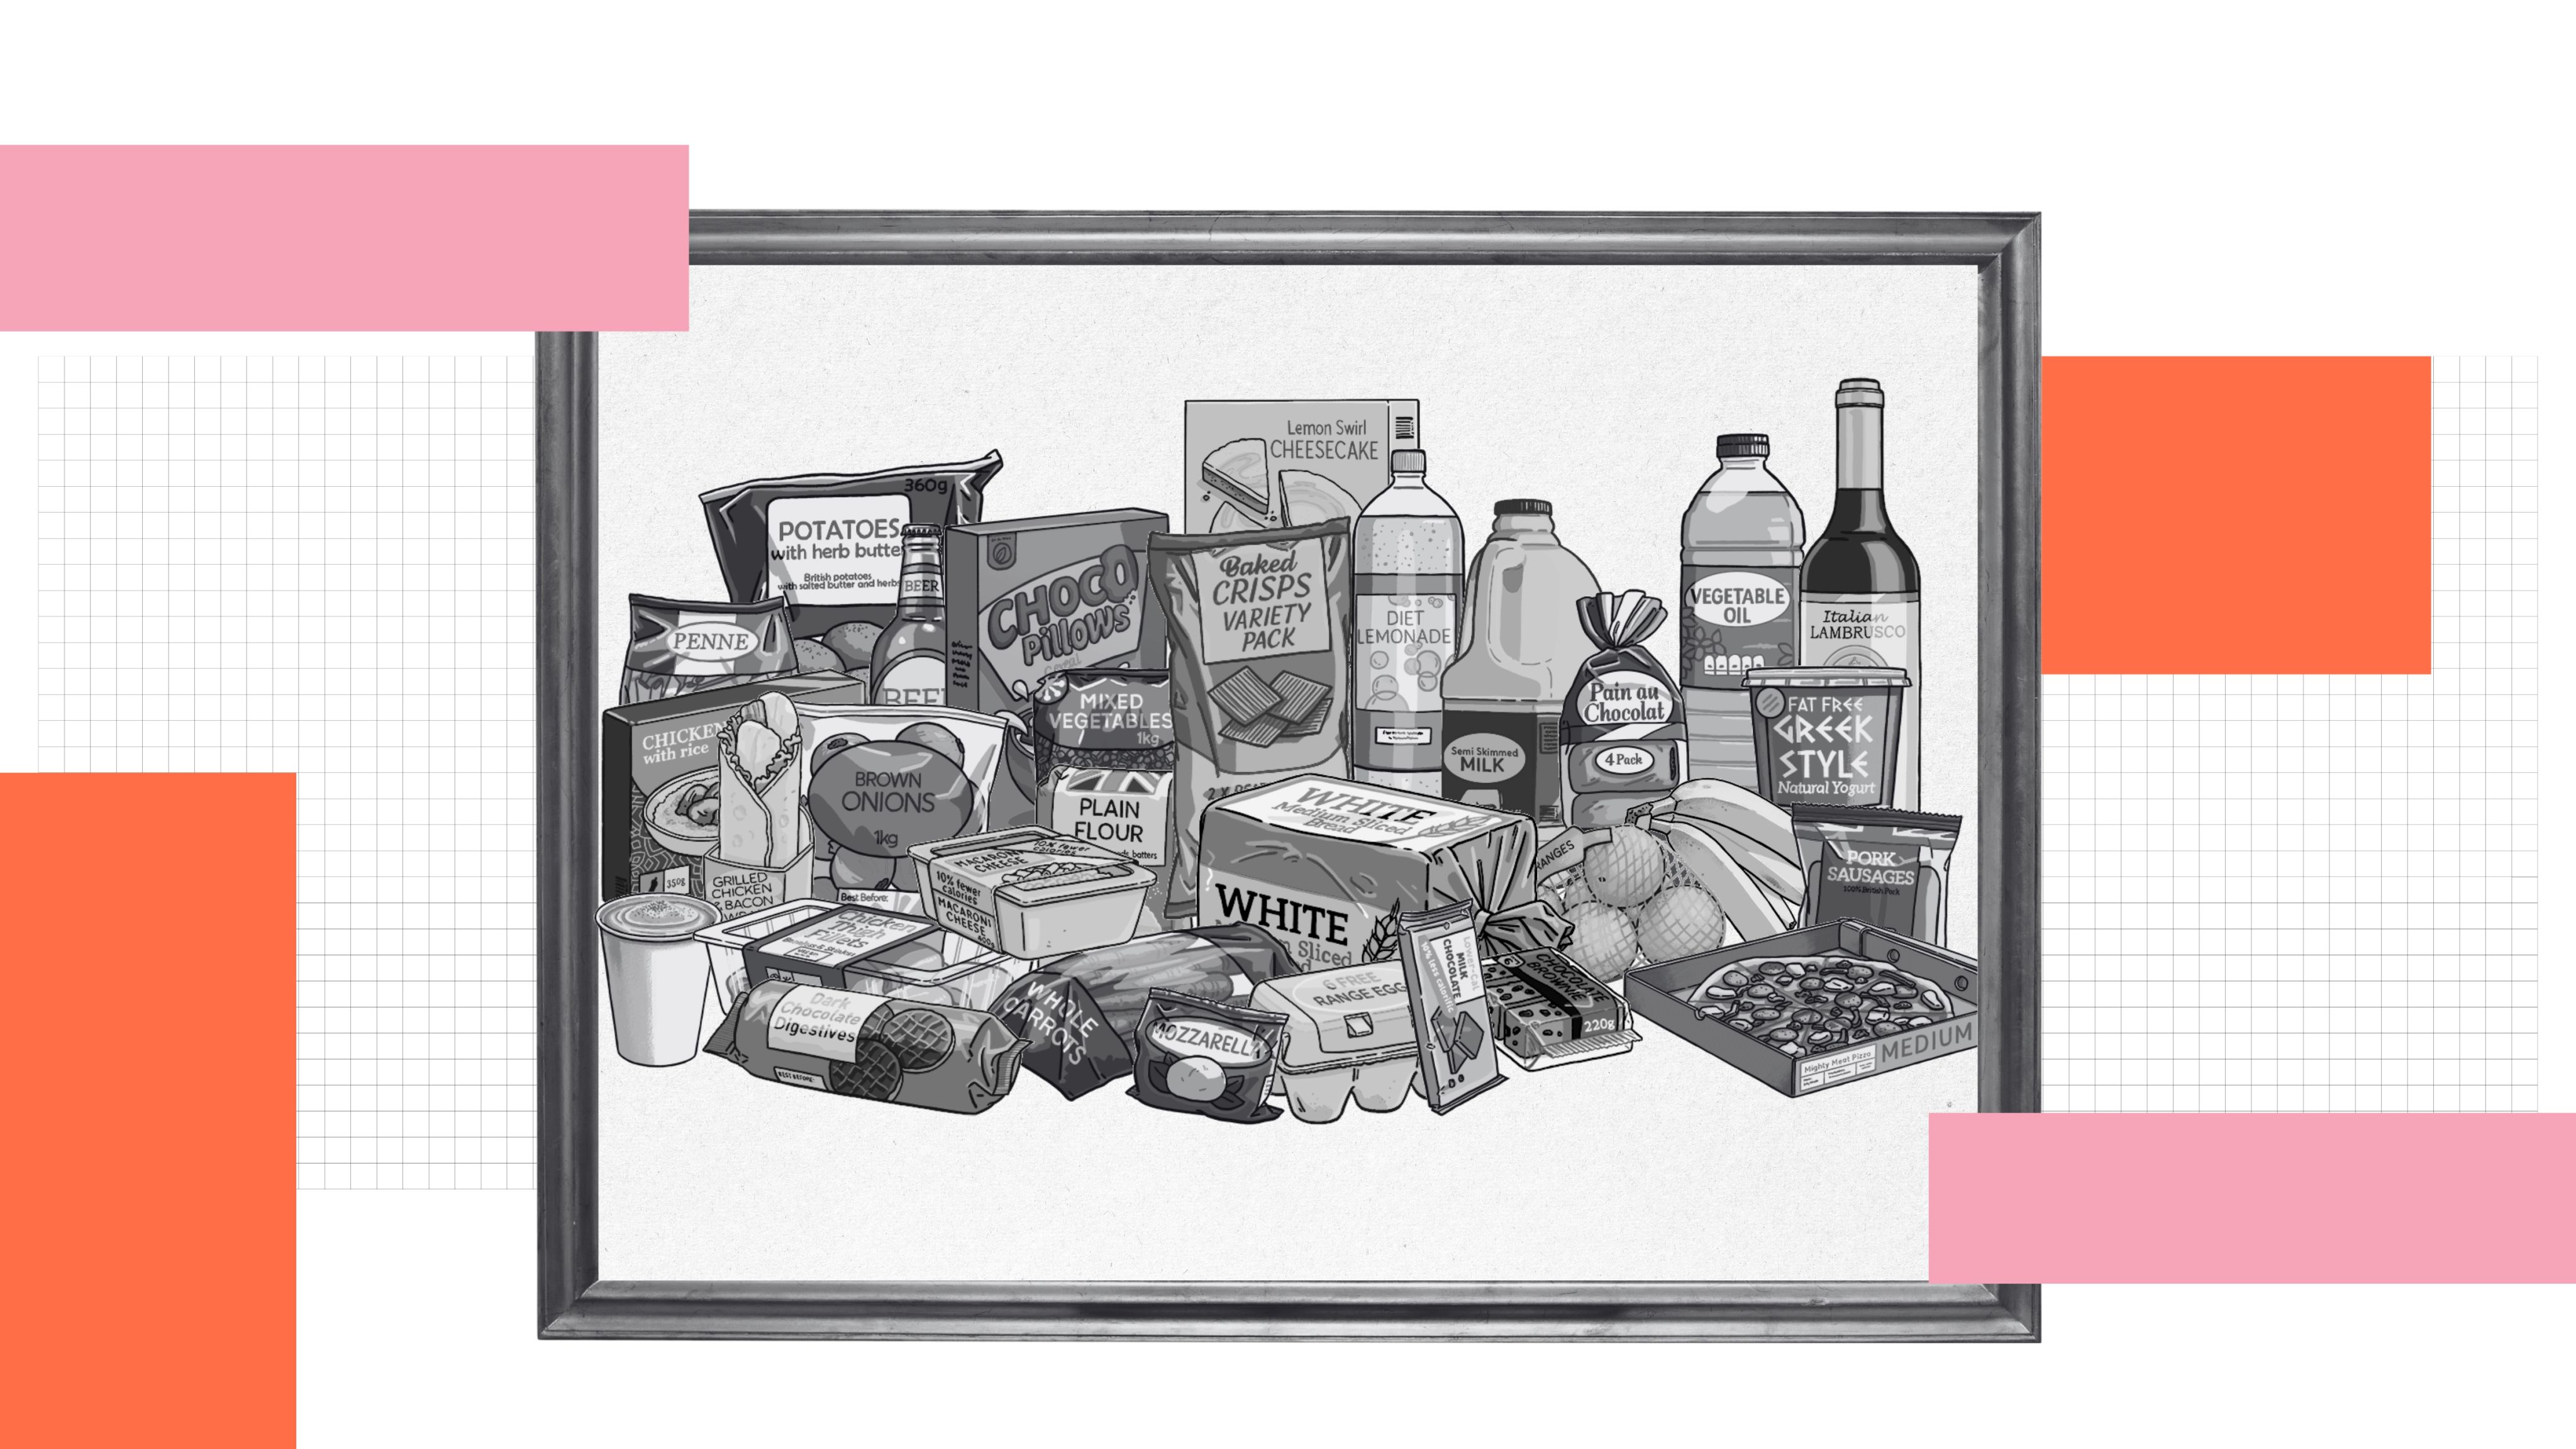
Why using the NPM for a ‘pass/fail’ score isn’t enough
Current policy treats the NPM as a binary. In HFSS regulations, it is applied as a pass/fair score to determine whether something is healthy (HFSS) or not. For some policies, like those restricting the placement of unhealthy foods in supermarkets, this binary fault line makes sense - a product can either be placed next to the checkout, or not. The downside is that categorising a product as healthy or unhealthy creates a cliff edge, with little nuance in between.
The problem is that this encourages companies to tweak recipes just enough to cross the line, rather than rewarding them for improving their least healthy products, or making their compliant ones even better.
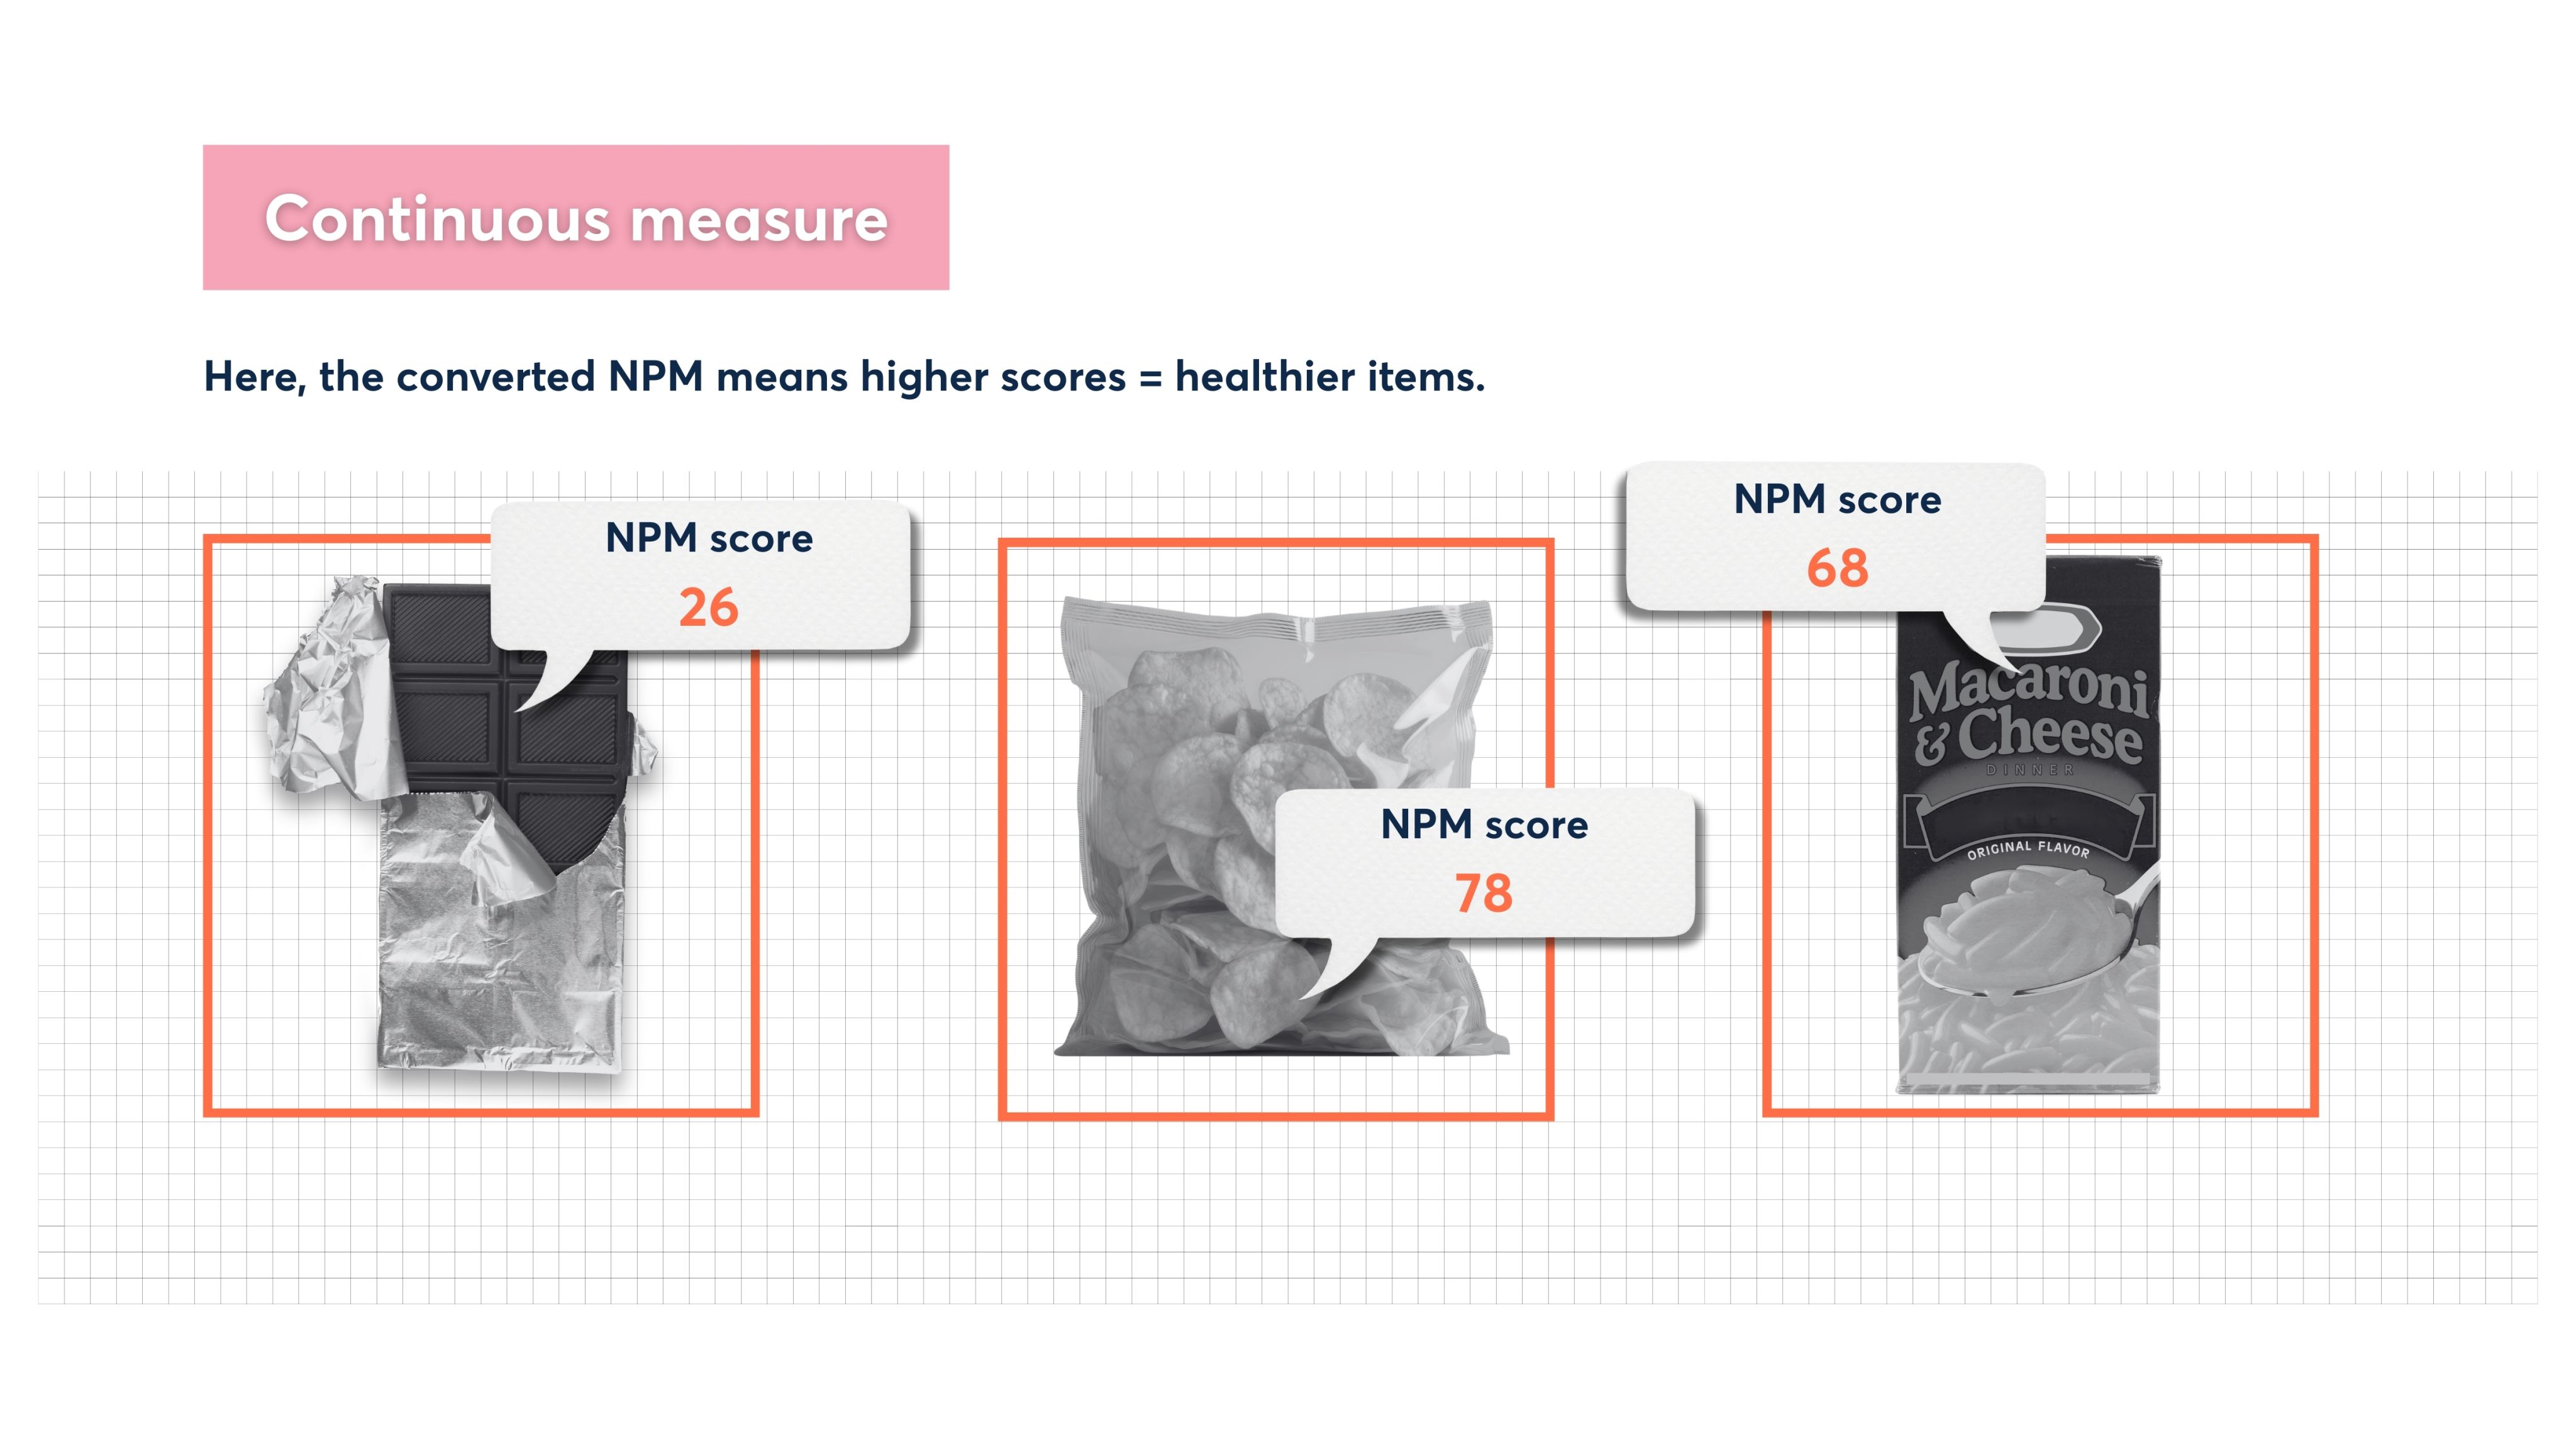
If we instead applied the NPM as a continuous measure - measuring any change in a portfolio average score - this could promote shifts across the entire product range. In other words, companies would be incentivised to make everything a little healthier, and all progress would be rewarded.
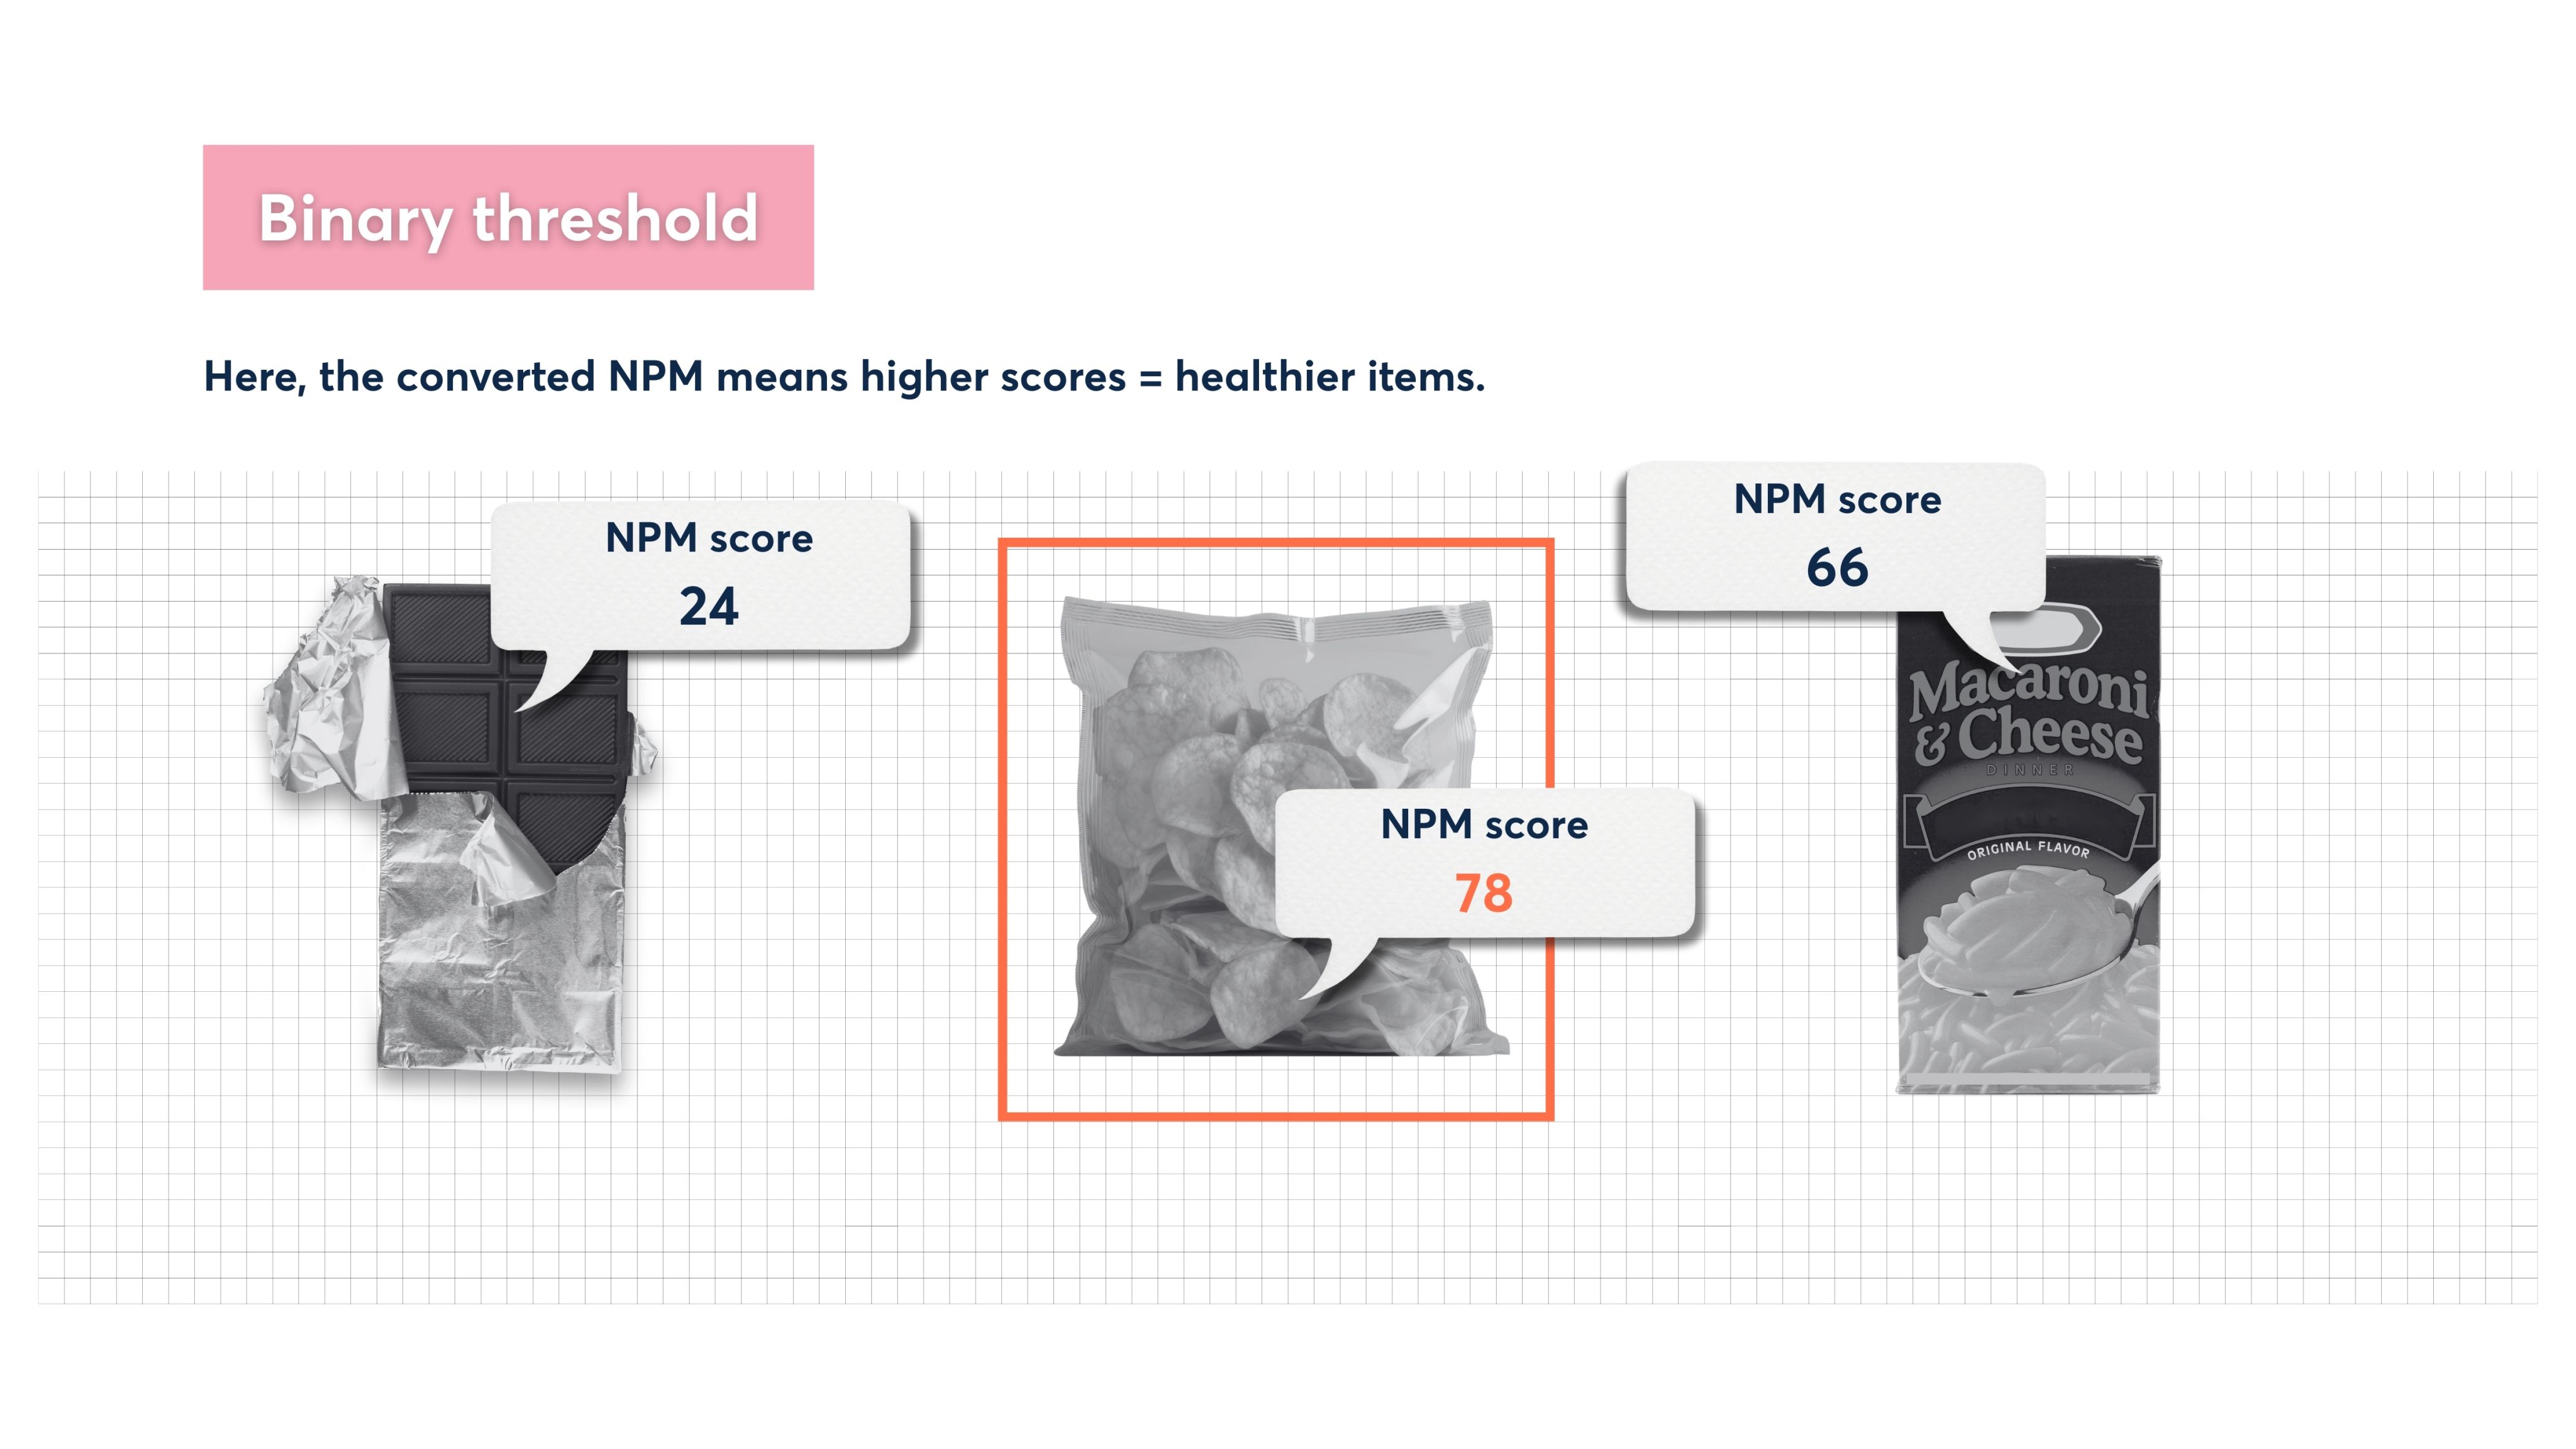
Using the NPM as a binary HFSS threshold only incentivises items just below the boundary to be improved. So the crisps, close to the threshold of 62, are made healthier.
If we instead apply the NPM as a continuous measure, then all improvements in the score are recognised. Now, there is also an incentive for the chocolate bar and macaroni & cheese to be made healthier.
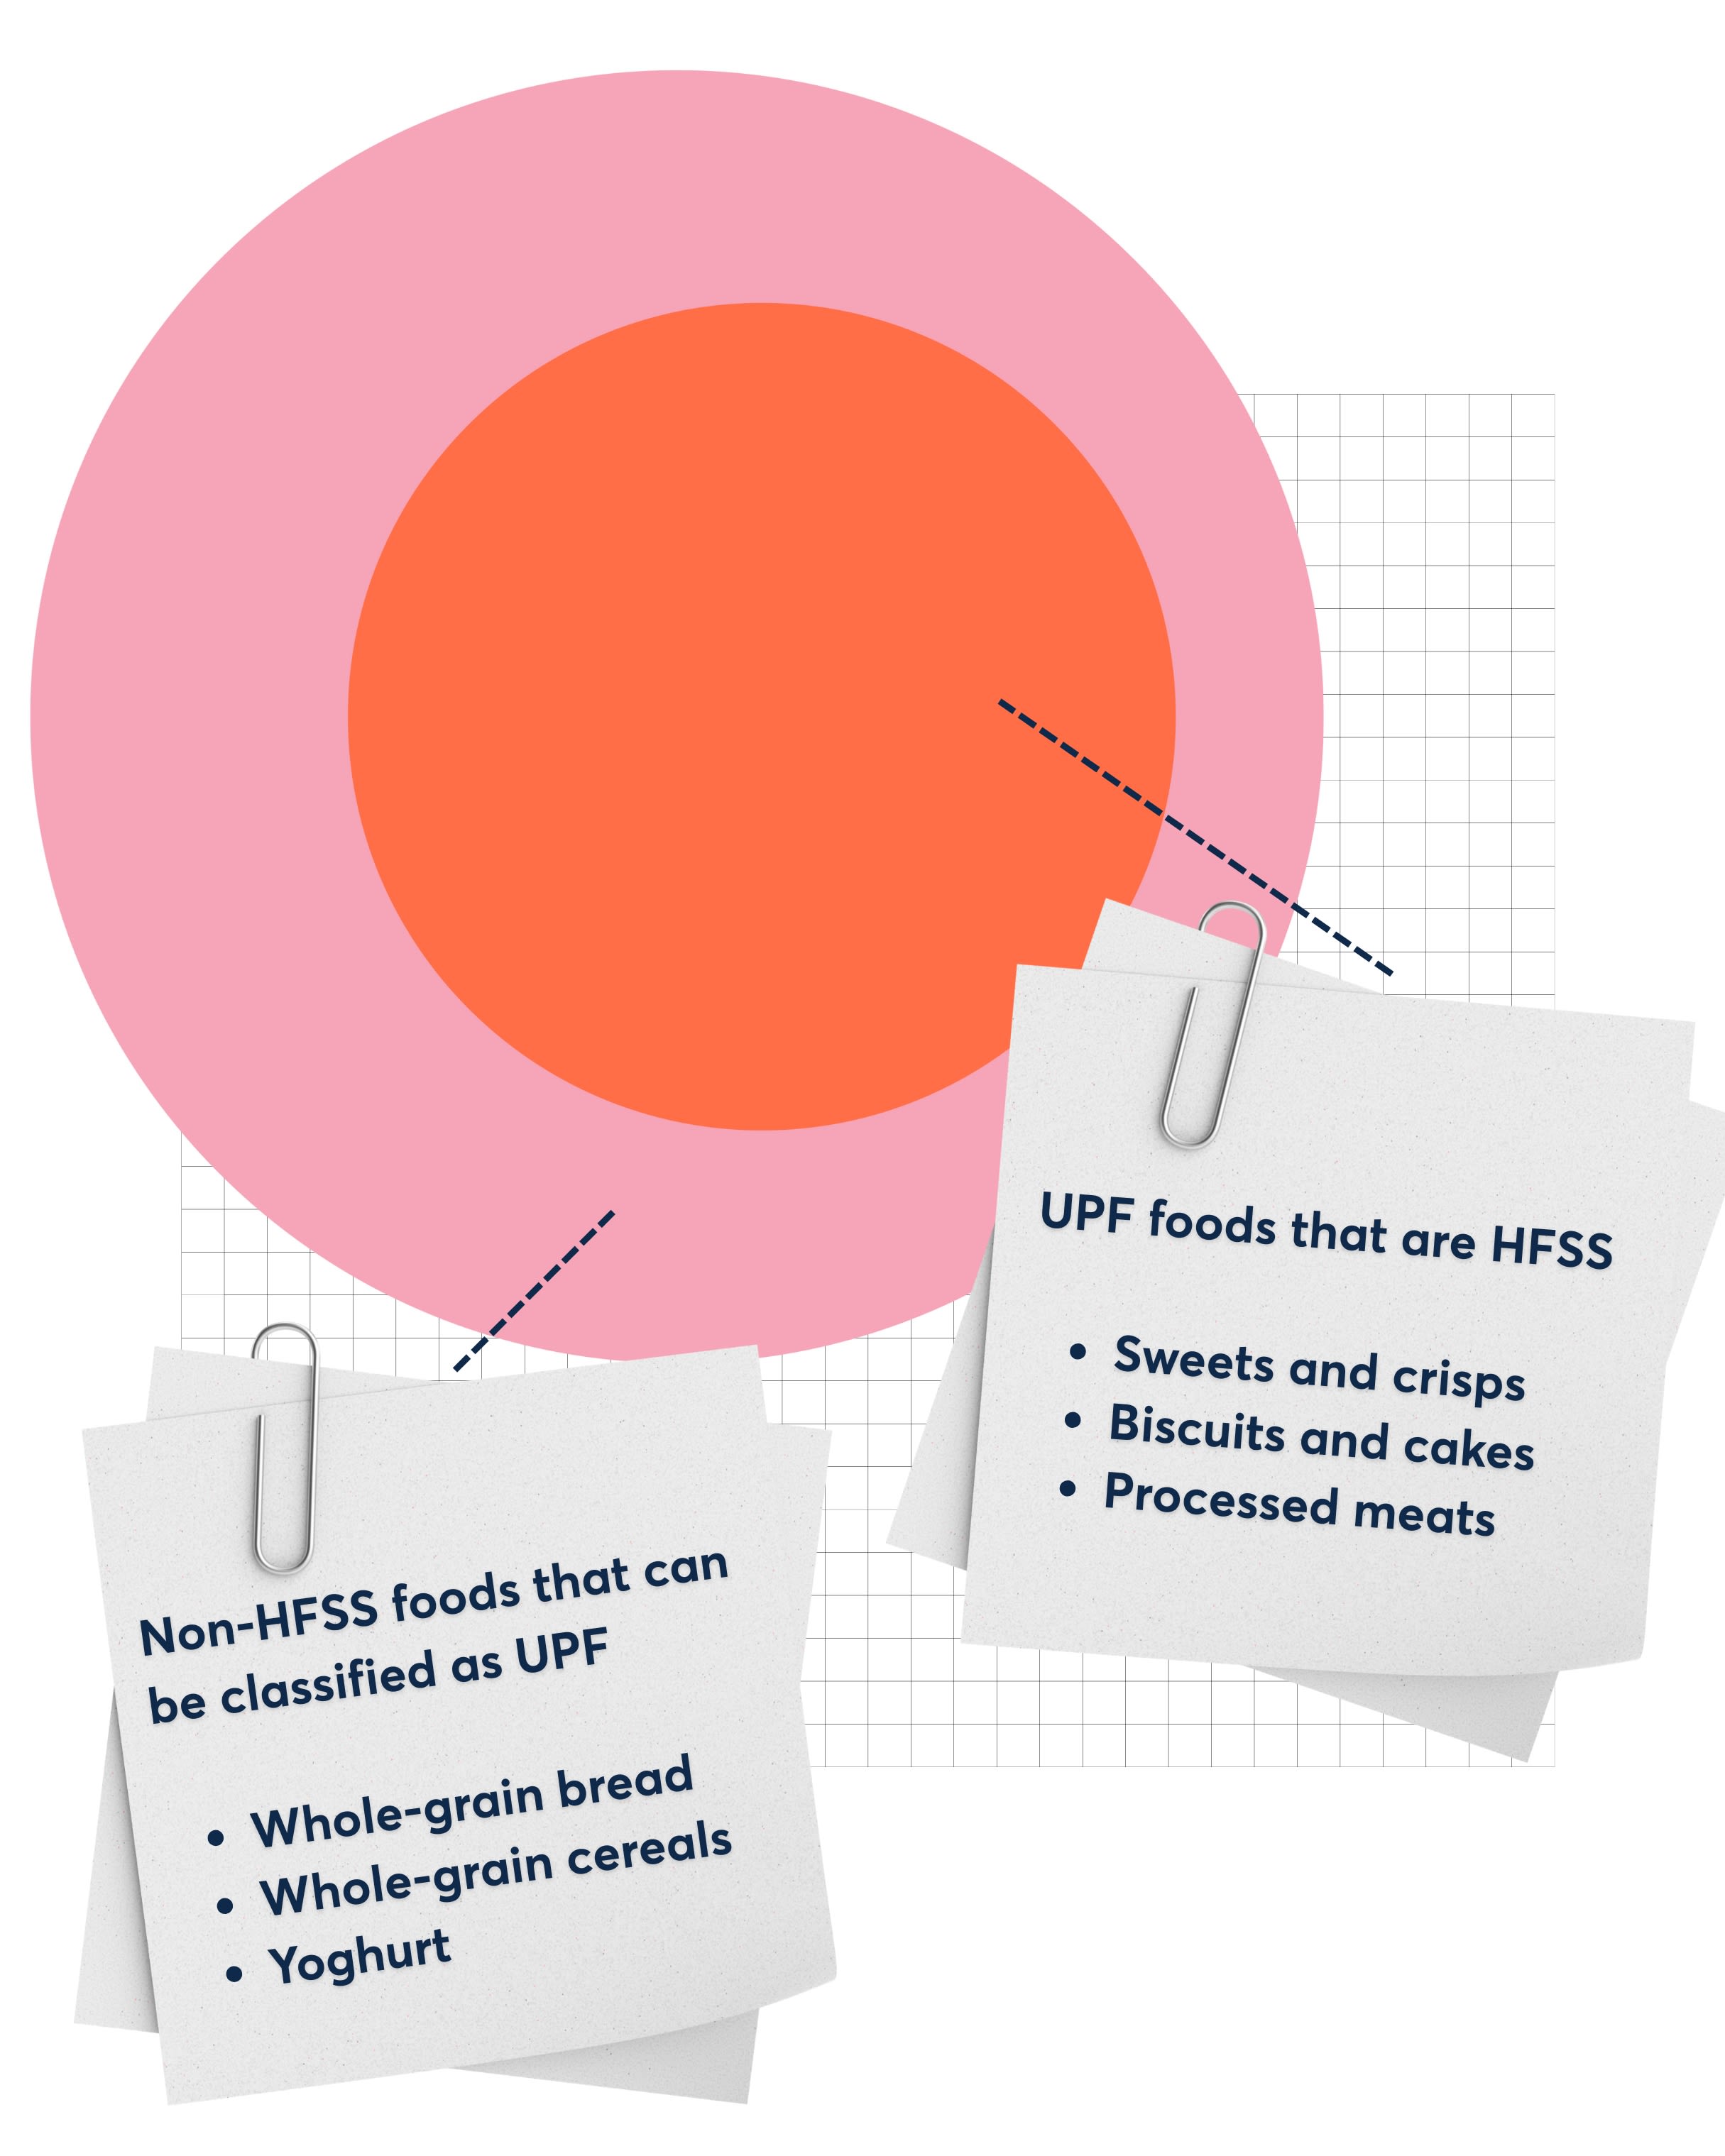
UPF and HFSS: different labels, same food?
Ultra-processed food (UPF) has become another lens for thinking about healthiness. There is rightly a lot of public concern about the level of processing in food. The term has captured attention regarding how the food marketed to us shapes our diets. However, it’s worth noting that this definition covers many of the same foods captured in the existing regulatory framework (HFSS foods defined by the NPM). So whether we speak of UPF or HFSS, we are broadly addressing the same products.
For example, Nesta found that 64% of calories from UPF come from products defined as HFSS. This overlap rose to 78% when bread and yoghurt were excluded - these staple foods tend to be classified as UPF but are not strongly linked to negative health outcomes.
This highlights an issue with UPF: there remains uncertainty about what drives its association with poor health, outside of more established risks like high salt, sugar, and energy density. Given the significant crossover between UPF and foods already categorised as HFSS, continuing with the NPM as the measure used to deliver food policy is the most sensible approach for now.
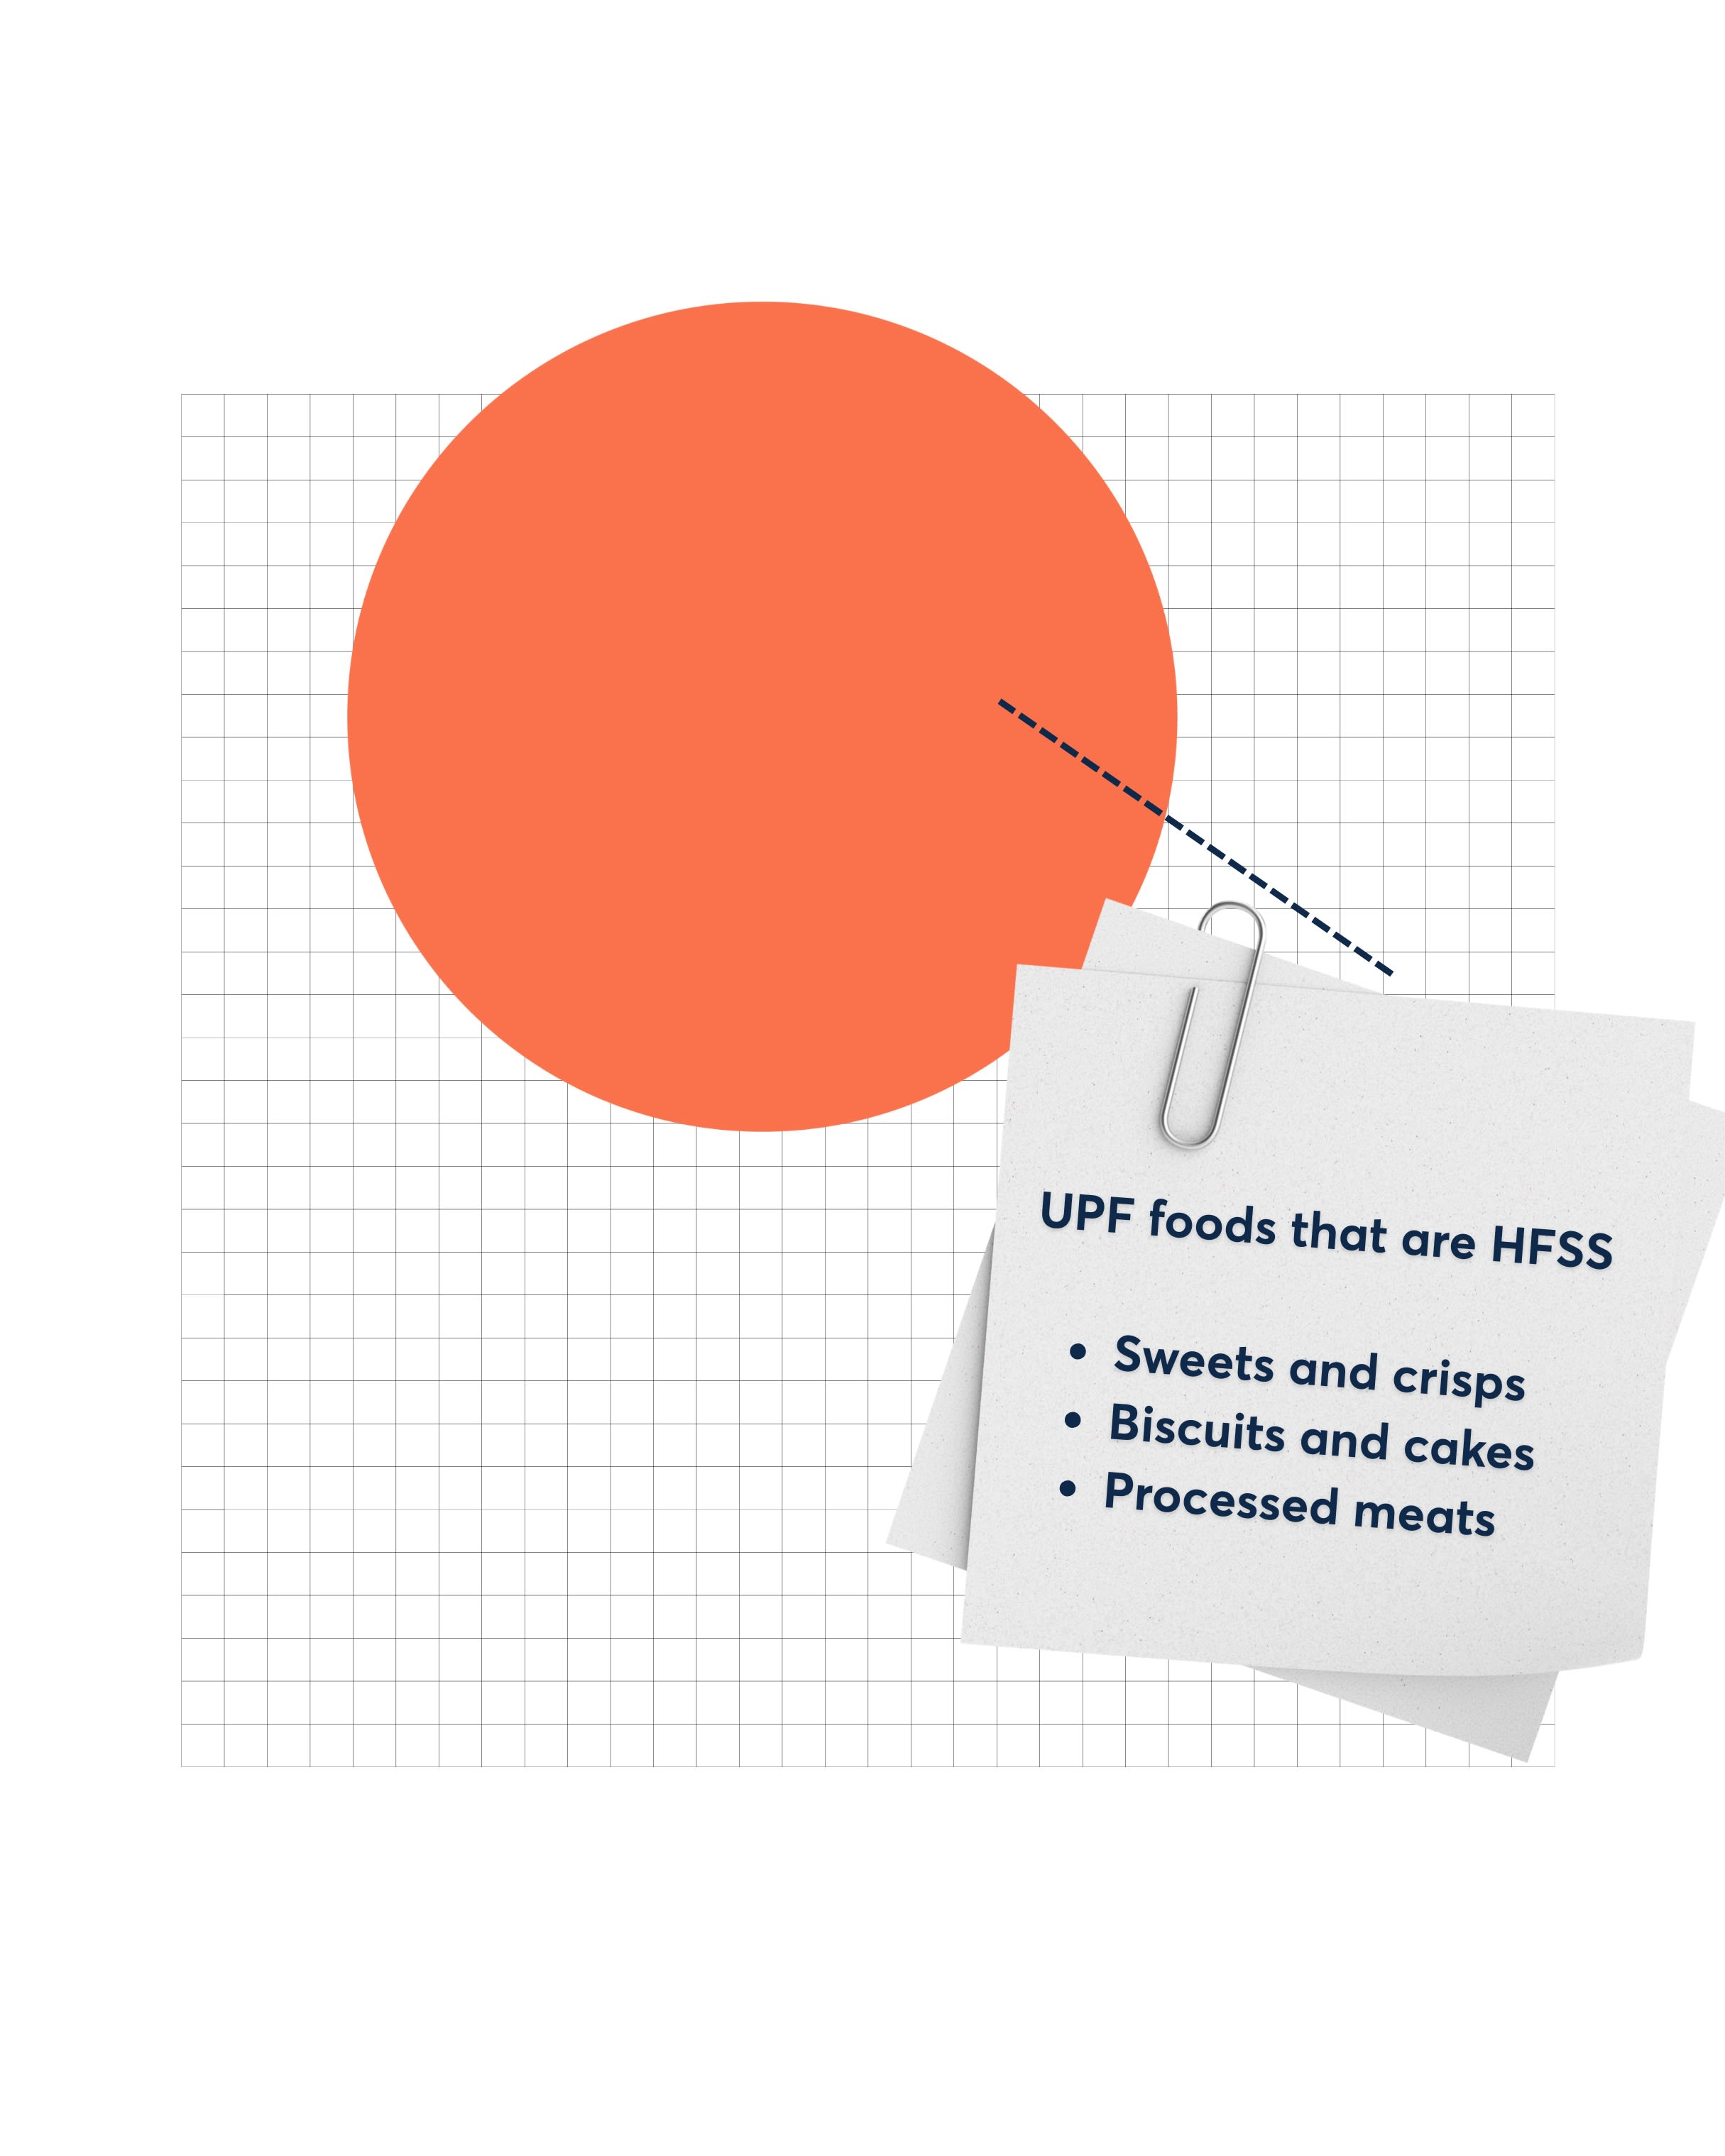
Many UPF products are already classified as HFSS, and some UPF foods are not strongly linked to negative health outcomes. (Diagram adapted from the World Cancer Research Fund).
Many UPF products are already classified as HFSS, and some UPF foods are not strongly linked to negative health outcomes. (Diagram adapted from the World Cancer Research Fund).
Many UPF products are already classified as HFSS, and some UPF foods are not strongly linked to negative health outcomes. (Diagram adapted from the World Cancer Research Fund).
Many UPF products are already classified as HFSS, and some UPF foods are not strongly linked to negative health outcomes. (Diagram adapted from the World Cancer Research Fund).

Many UPF products are already classified as HFSS, and some UPF foods are not strongly linked to negative health outcomes. (Diagram adapted from the World Cancer Research Fund).
Many UPF products are already classified as HFSS, and some UPF foods are not strongly linked to negative health outcomes. (Diagram adapted from the World Cancer Research Fund).
UPF and HFSS: different labels, same food?
Ultra-processed food (UPF) has become another lens for thinking about healthiness. There is rightly a lot of public concern about the level of processing in food. The term has captured attention regarding how the food marketed to us shapes our diets. However, it’s worth noting that this definition covers many of the same foods captured in the existing regulatory framework (HFSS foods defined by the NPM). So whether we speak of UPF or HFSS, we are broadly addressing the same products.
For example, Nesta found that 64% of calories from UPF come from products defined as HFSS. This overlap rose to 78% when bread and yoghurt were excluded - these staple foods tend to be classified as UPF but are not strongly linked to negative health outcomes.
This highlights an issue with UPF: there remains uncertainty about what drives its association with poor health, outside of more established risks like high salt, sugar, and energy density. Given the significant crossover between UPF and foods already categorised as HFSS, continuing with the NPM as the measure used to deliver food policy is the most sensible approach for now.


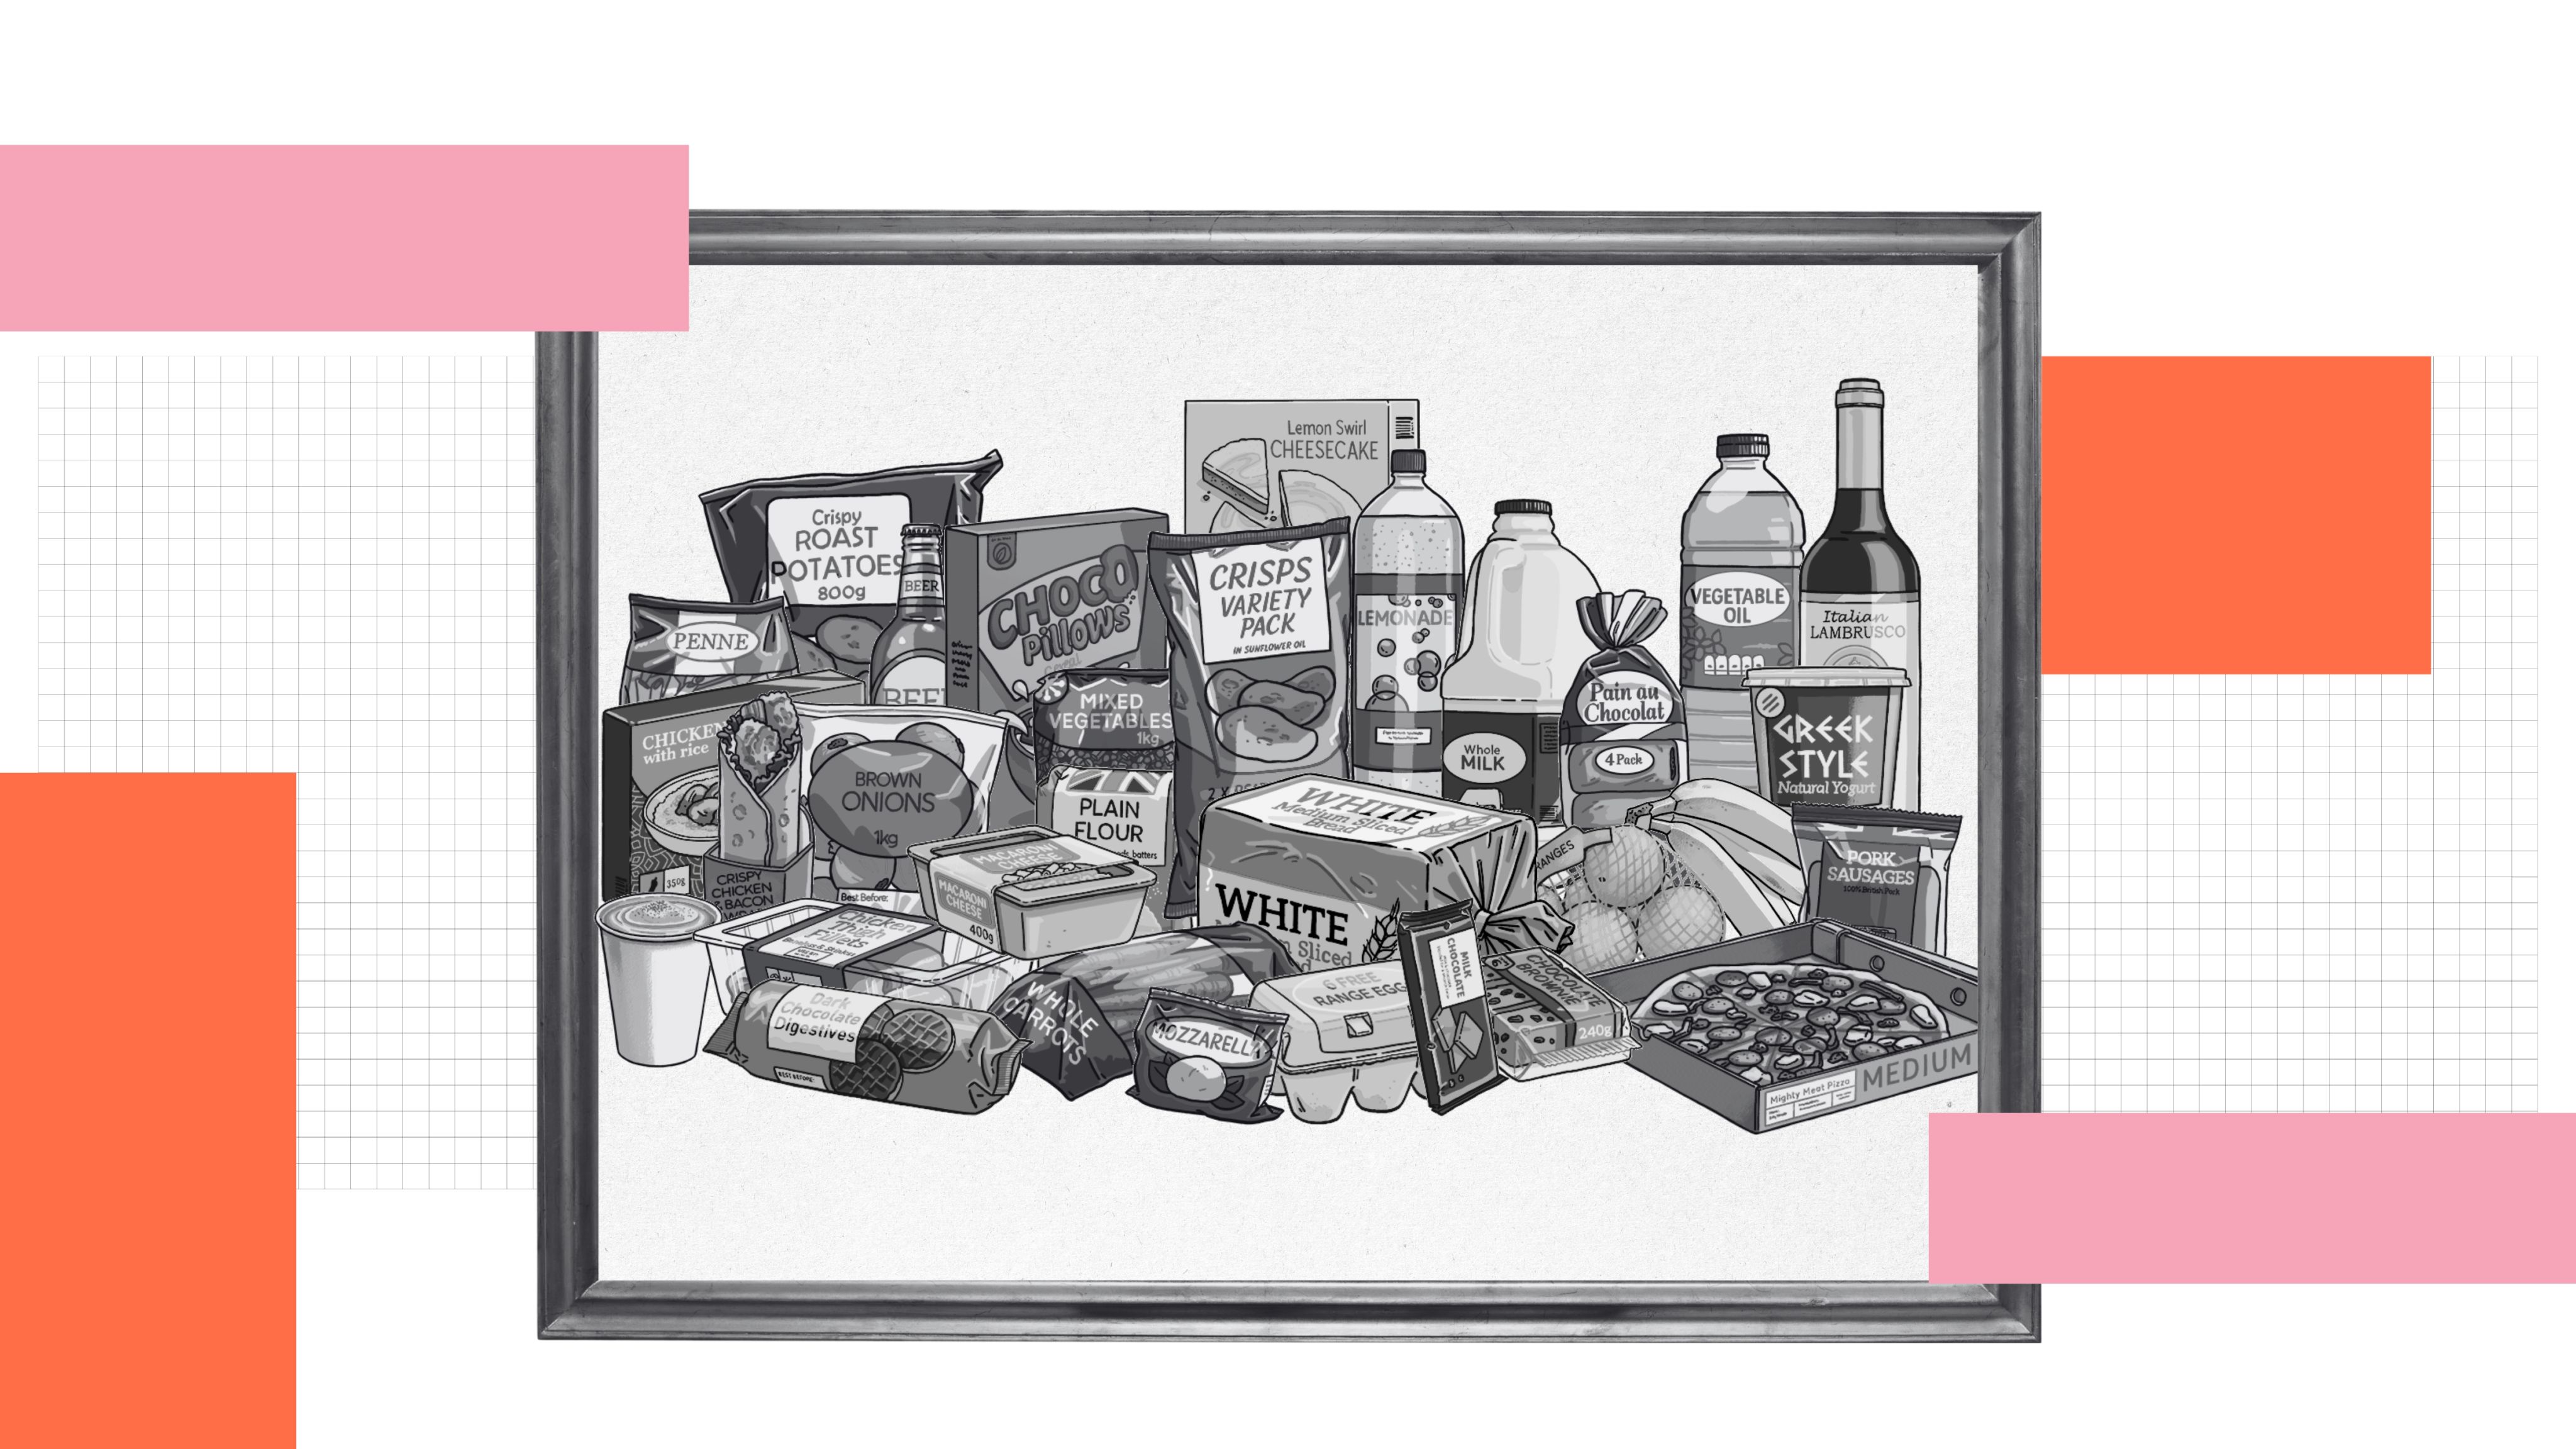
Using the NPM as a continuous measure means all foods could become healthier by default
Ultimately, what drives change is how a measure of healthiness is applied in policy. Crucially, we recommend using the NPM across more food policies, but applying it as a continuous measure.
The healthy food standard, announced in the government’s 10 Year Health Plan, is the ideal vehicle for this. It could apply the NPM as a sliding scale, rather than a binary switch. The policy gives businesses the flexibility to make improvements across a wider range of products, in a way that suits their customers and business models. The government has also announced plans to update the NPM currently used in legislation, but we do not see the need for this to delay the implementation of policies like the healthy food standard.
By setting targets based on the average health score of a business' total sales, the policy would encourage large food businesses to make everything a little healthier. And it would use a metric businesses have already adopted for HFSS regulation. It moves us away from improving only the least healthy foods (just ~25% of sales classified as HFSS) and toward a system where the average shopping basket becomes healthier by default.
The healthy food standard would apply the NPM as a sliding scale, encouraging small tweaks to a range of products to make the healthier choice the easier choice.

The healthy food standard would apply the NPM as a sliding scale, encouraging small tweaks to a range of products to make the healthier choice the easier choice.
The healthy food standard would apply the NPM as a sliding scale, encouraging small tweaks to a range of products to make the healthier choice the easier choice.
The healthy food standard would apply the NPM as a sliding scale, encouraging small tweaks to a range of products to make the healthier choice the easier choice.
The healthy food standard would apply the NPM as a sliding scale, encouraging small tweaks to a range of products to make the healthier choice the easier choice.
The healthy food standard would apply the NPM as a sliding scale, encouraging small tweaks to a range of products to make the healthier choice the easier choice.
The healthy food standard would apply the NPM as a sliding scale, encouraging small tweaks to a range of products to make the healthier choice the easier choice.
Using the NPM as a continuous measure means all foods could become healthier by default
Ultimately, what drives change is how a measure of healthiness is applied in policy. Crucially, we recommend using the NPM across more food policies, but applying it as a continuous measure.
The healthy food standard, announced in the government’s 10 Year Health Plan, is the ideal vehicle for this. It could apply the NPM as a sliding scale, rather than a binary switch. The policy gives businesses the flexibility to make improvements across a wider range of products, in a way that suits their customers and business models. The government has also announced plans to update the NPM currently used in legislation, but we do not see the need for this to delay the implementation of policies like the healthy food standard.
By setting targets based on the average health score of a business' total sales, the policy would encourage large food businesses to make everything a little healthier. And it would use a metric businesses have already adopted for HFSS regulation. It moves us away from improving only the least healthy foods (just ~25% of sales classified as HFSS) and toward a system where the average shopping basket becomes healthier by default.
Conclusion
Most people want to eat more healthily - in fact, a Nesta and BIT survey found that 67% of people want to lose weight. But turning that desire into action can be difficult when our food environment often drives us to overconsume unhealthy food.
While public interest in healthy food is growing, empowering consumers with definitions is not enough. From the government's Eatwell Guide to voluntary Front of Pack traffic light labelling to the evolving debate on UPF, guidance exists - but most people don't have the time, resources or will decode it all. Effective policy must improve the food environment rather than relying on individuals to make better choices.
Nesta's research confirms that information and education alone barely move the needle. That's why the NPM is such a critical lever. It could be used to shift incentives for large food businesses, encouraging them to reprioritise what they promote and sell. When we modelled this approach in supermarkets we found it could reduce obesity by around one-fifth - benefiting everyone, no matter where they live or what they earn.