Innovation Sweet Spots: Food innovation, obesity and food environments
Chapter 2: Venture capital investment into food innovations and technologies
This chapter describes our findings on global venture capital flows into food innovation and technology companies. Venture capital is an important component of the innovation system, as it provides capital for (typically high-risk) ideas that need to be tested in the market. As such, the trends and innovations characterised in this chapter are already starting to make an impact on food environments.
Our analysis shows that the previous decade has been an exciting period of growth for food innovation and technology start-ups (we estimate an approximate forty-fold increase in early stage venture funding from £670 million in 2011 to £26.9 billion in 2021). Conversely in 2022, amidst a global market downturn, we estimated that food innovation and technology start-up funding has decreased by more than half compared to 2021 (-54% at £12.4 billion). Given the uncertainty of the short-term outlook, we have focused on the trends leading up to this venture funding pullback, while addressing more recent shifts where possible.
We found that the majority of venture funding (60%) in 2017-2021 has been directed to food delivery and logistics companies, an area our expert panel raised concerns about in terms of possible impact on food environments (Chapter 6). That said, there has been strong growth in levels of investment into practically all other innovation areas as well, including health-related and food reformulation start-ups. Funding for innovative food and agritech start-ups appears particularly ‘hot’ according to our trends typology (fast growth and large investment amount); health-related innovations, and food packaging and waste reduction technologies appear ‘emerging’ (rapid growth with more modest investment amounts); whereas start-ups in the ‘cooking and kitchen’ and ‘restaurants and retail’ categories appear transitioning between these two trends categories. We discuss and provide examples for each of these categories in turn.
In the appendix of this chapter, we also describe UK-specific trends. In the UK, food delivery and logistics companies are also leading in venture funding, but the distribution across innovation categories appears more balanced compared to the global situation. Among other countries, the UK ranks sixth in terms of the overall early stage investment between 2017 and 2021, with an intermediate growth level (109%) - higher compared to the US and China but lower than, for example, France and the Netherlands.
Overview of global venture funding for food technology start-ups
We estimated that the global (early stage) venture funding has increased from £670 million in 2011 to £26.9 billion in 2021 (approximately forty-fold increase; see Figure 9). Early stage investment deals include, for example, seed and series A funding that are usually associated with start-ups. This increase is higher than the baseline growth of the total venture funding across all sectors during the same time period, which we estimated to have increased approximately ten-fold.
More recently, 2021 was a record year in overall venture funding, with our analysis showing a 91% increase for food innovation and technology start-ups compared to 2020 (from £14.1 billion to £26.9 billion). Conversely in 2022, amidst a global market downturn the early stage funding has decreased by around half compared to 2021 (-54% at £12.4 billion).
Overall, this is indicative of a period of growing interest in food innovation on the part of investors, which will continue to impact the sector in coming years. However, given the new market conditions we can expect a bumpy period of readjustment as start-ups in the food sector respond to the venture capital pullback.
Global growth trends by innovation category
In the five years preceding the ongoing market correction, most categories of food innovations have raised early stage venture capital at a rate that’s close to, or above, the baseline investment growth across all sectors of venture funding (see Figure 10 below). In the following, we characterise trends around the broader innovation categories, with subcategories and specific examples of start-ups discussed in further sections of this chapter.
The areas of ‘innovative food’ (£2.16 billion yearly investment and 588% growth between 2017 and 2021) and ‘agritech’ (£3.57 billion and 289% growth) have raised impressive amounts of venture funding at a particularly fast pace, which is why we would consider these innovation areas as ‘hot’ according to our trends typology.
Early stage deals between 2017 and 2021 (eg, seed and series funding)
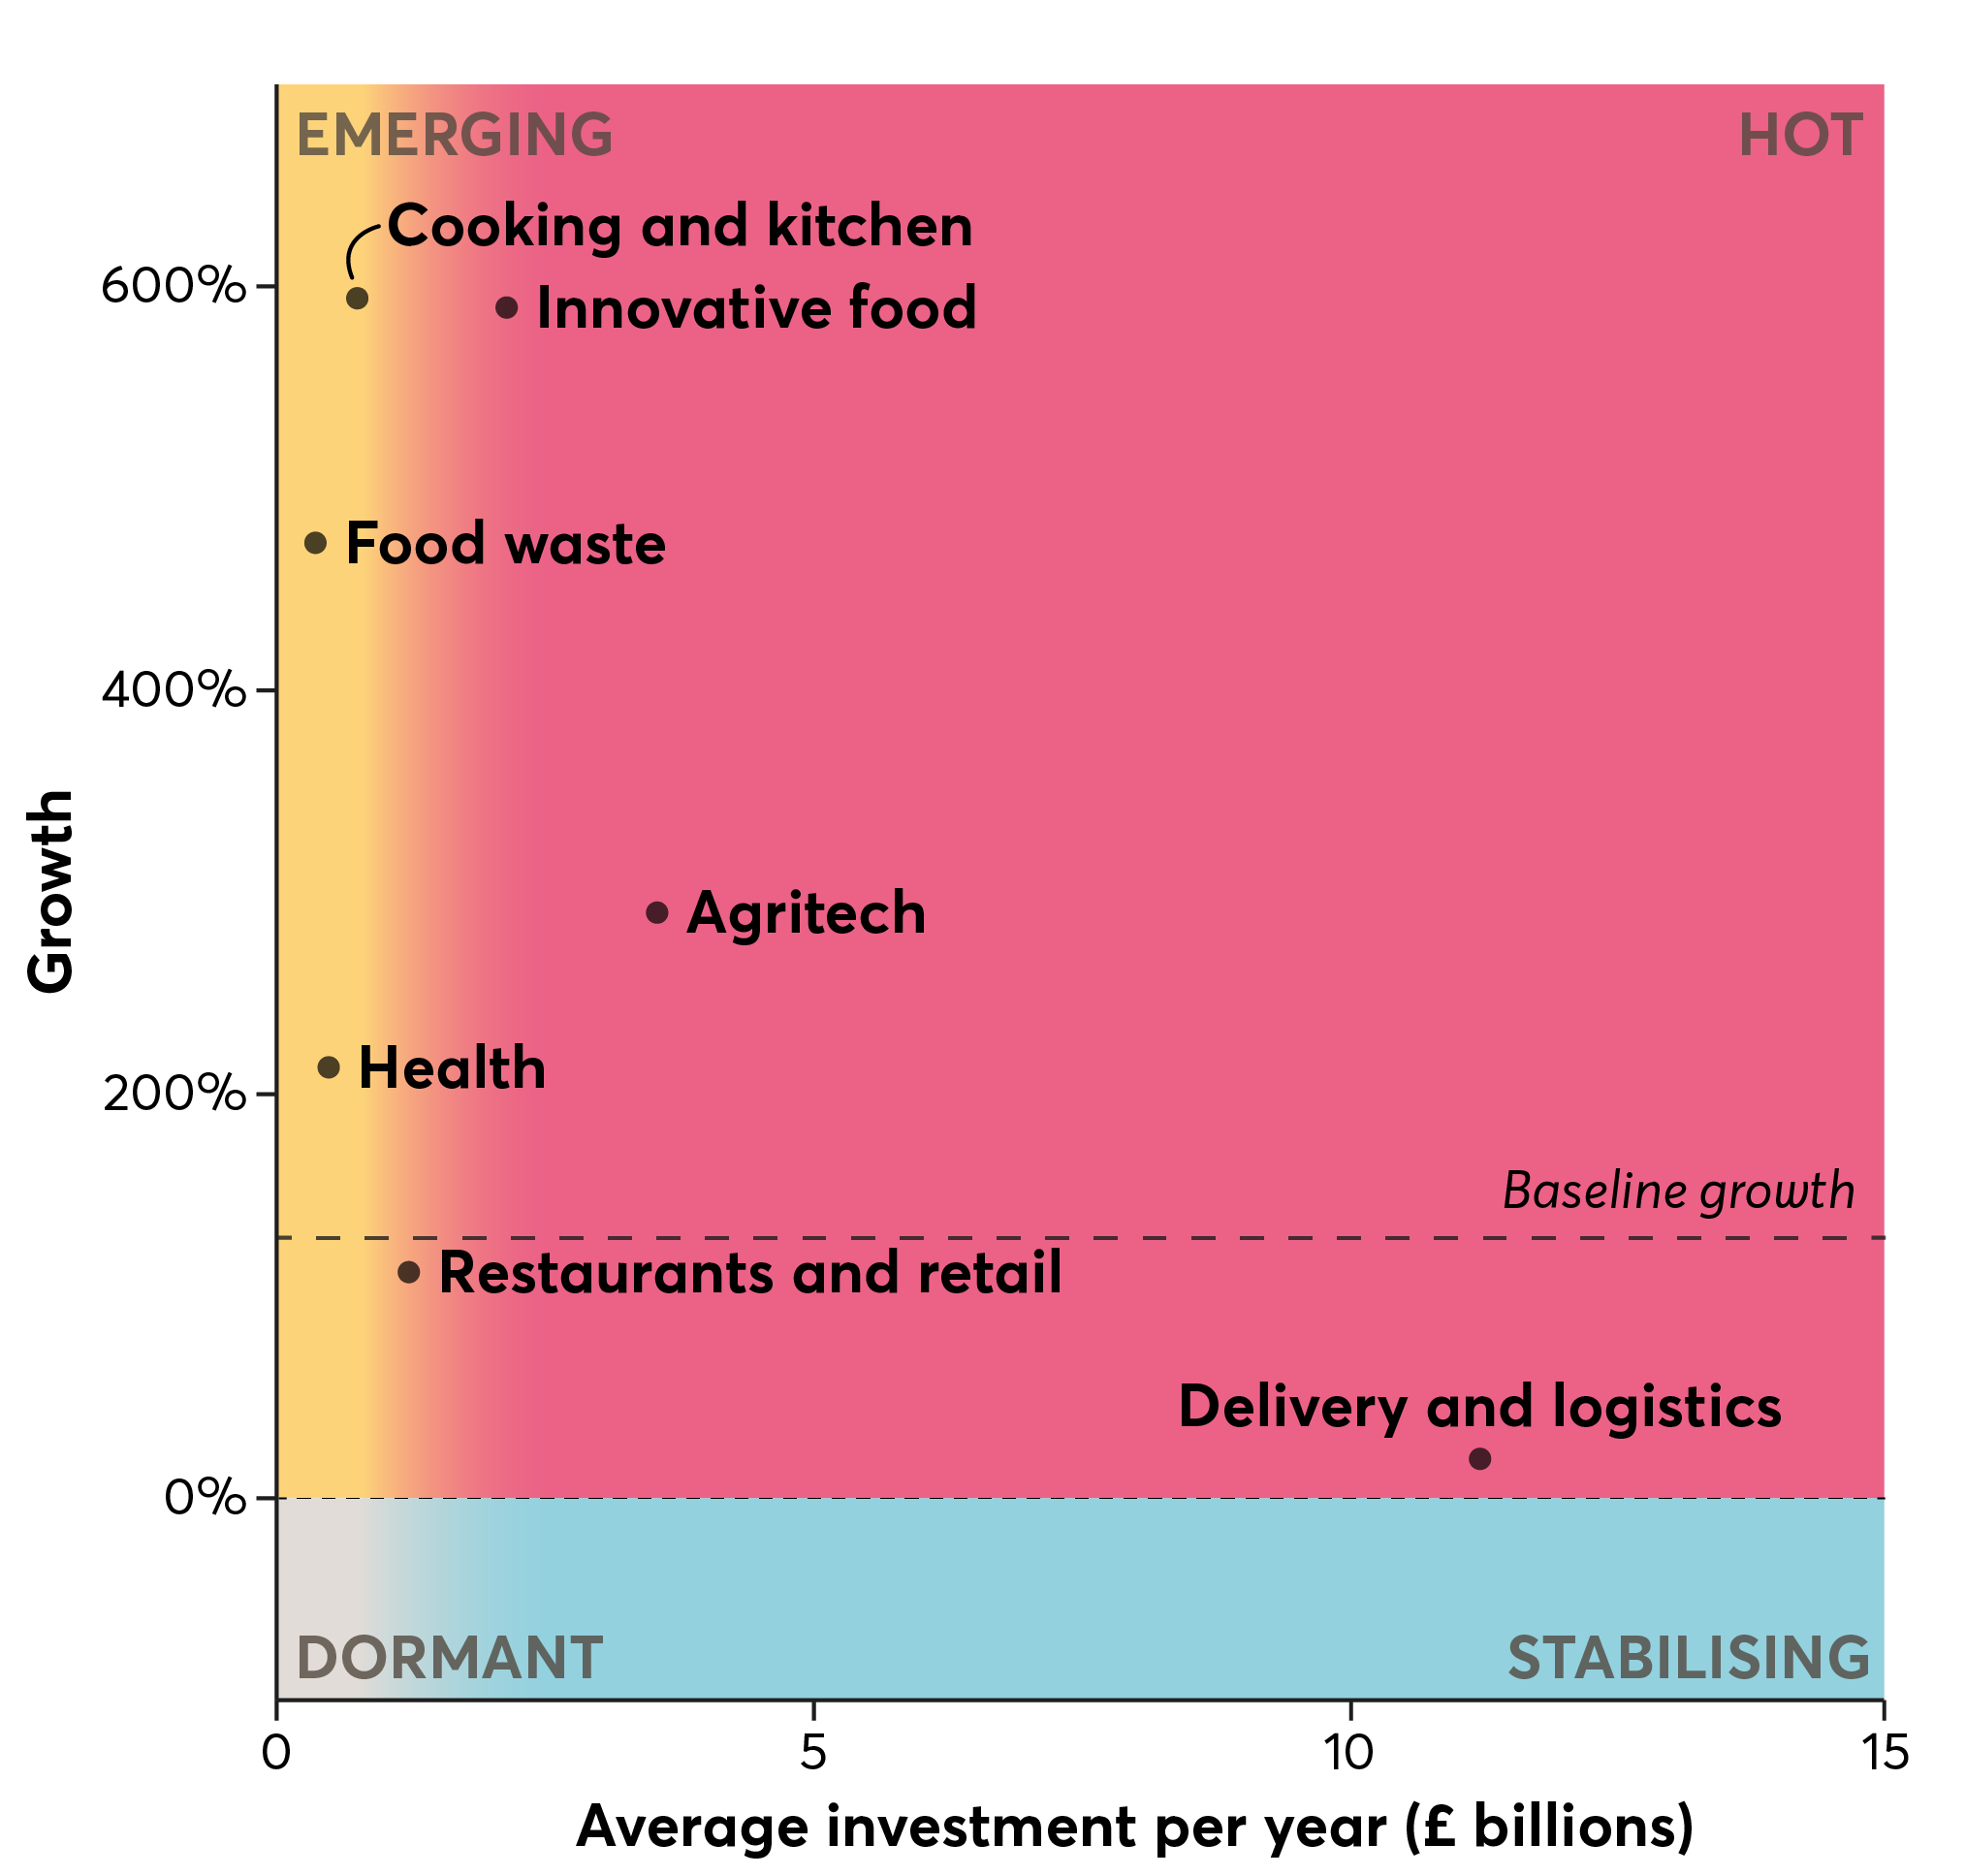 Source: Nesta’s analysis of Dealroom and Crunchbase data • Growth is a smoothed estimate that compares the rolling three-year average of investment in 2017 versus 2021. The dashed line indicates a baseline growth estimate of the total venture capital investment growth (128%) in the same time period. ‘Food waste’ includes food waste reduction and packaging.

Other, more ‘emerging’ areas such as food waste reduction and packaging (£380 million per year on average and 472% growth between 2017 and 2021) and health-related start-ups (£504 million and 212% growth) have raised comparatively smaller investment amounts while also exhibiting a high growth rate.
Meanwhile, the innovation categories of ‘cooking and kitchen’ (£593 million and 770% growth) and ‘restaurants and retail’ (£1.25 billion and 111% growth) appear to be transitioning between the ‘emerging’ and ‘hot’ categories.
Strikingly, the category of ‘delivery and logistics’, with a massive average of £11.2 billion new investment per year, has attracted the majority (60%) of all early stage investment in food innovations between 2017 and 2021. This category, which includes food and grocery deliveries as well as meal kits and supply chain solutions like cold storage and picker robots has been classed as between 'hot' and ‘stabilising’ due to a comparatively lower growth estimate (18.5% growth). This category had already seen a period of strong growth earlier in the decade during the so-called “first wave” of food tech investment led by food delivery start-ups like the UK-based Deliveroo and Just Eat, and Germany-based meal kit providers Hello Fresh.
A more emergent trend within the delivery and logistics area has been the rapid growth of ultra-fast delivery start-ups such as Getir and Gorillas, which aim to bring groceries to the doorstep in just 10 to 20 minutes. Estimates suggest that start-ups specialising in these services raised more than nine times the investment in 2021 compared to 2020. The market downturn in 2022, however, has meant that some of these companies had to announce layoffs of hundreds or thousands of their employees, raising questions about the resilience of this model.
Maturing delivery and logistics innovations are driving late stage investment growth
The maturation of food delivery and logistics innovations is further emphasised by large amounts of late stage venture funding, skyrocketing from an estimated £2.5 billion in 2017 to £17.4 billion in 2021. These later stage investments are characteristic of more established companies and include deals such as acquisitions, debt financing, initial public offerings (IPO), and post-IPO funding. While other innovation categories have also seen some late stage investment activity, this is dwarfed by the investments into delivery and logistics companies (see Figure 3 below).
Examples of recent late stage deals include the London-based food delivery platform Just Eat’s £16 million acquisition of corporate catering company City Pantry in 2019 and its £6.2 billion merger with Takeaway.com in 2020, as well as Deliveroo's £1.5 bn IPO in 2021. Analysts predict further consolidation of food delivery businesses in the future that might eventually result in a smaller number of relatively large players.
Meal kit companies, which are also included in the ‘delivery and logistics’ category, have shown signs of consolidation as well. For example, the multinational food and drinks producer Nestlé bought up SimplyCook, Mindful Chef and Freshly – suggesting a move towards the direct-to-consumer market. The merger between meal kit company Sun Basket and dietary supplements company Pruvit in 2021 is also an interesting signal of meal kits becoming integrated into a wider wellness offer.
Given that online food delivery sales keep increasing in the UK, it becomes increasingly important to consider the types of groceries and meals which are typically being purchased via these services. There are indications that food purchased from restaurants, fast-food outlets and takeaways is usually associated with higher calorie intakes. A recent collaboration by the London School of Hygiene and Tropical Medicine and the Haringey London Borough Council showed that rapid grocery delivery platforms primarily sold items that were high in fat, salt, and sugar, as well as alcoholic beverages and tobacco, and that these items were more likely to be promoted through offers and promotional language. Therefore, interventions and further innovation around food delivery and logistics products and services might be necessary to ensure the impact on health is not negative.
Venture funding trends across different innovation categories
Besides the maturation of delivery and logistics investments, there have been other notable venture funding trends in recent years, such as the rapid rise of dark kitchen and lab-grown meat start-ups (see Figure 12 below). The following sections provide further discussion of these and other trends across the different innovation subcategories. Through these sections, we will focus on early stage deals as those are usually associated with start-up activity.
Rise of dark kitchens and kitchen technologies
The development of more efficient and automated kitchen technologies has potential to boost the productivity of the food services sector and reduce the price of prepared food. However, given that key applications of these technologies to date have tended towards ‘fast food’ settings (for example, automated fryers that can produce 60kg of french fries per hour) the impact on the quality of diets is unclear. It will therefore be important to monitor how these innovations are deployed, providing support to start-ups orientated towards the production of healthy food.
‘Dark kitchens’ (a subcategory of cooking and kitchen innovations) are food preparation sites serving customers exclusively by delivery or pick up, and are thus closely linked to food delivery and logistics. According to our analysis, the venture funding for ‘dark kitchen’ subcategory has grown more than 140 times, with about £485 million invested per year on average between 2017 and 2021 (see Figure 13 below). The growth of this innovation area has been in part propelled by the Covid-19 pandemic, when restaurants were forced to close, and many food services added deliveries to their offer and adopted the dark kitchen model.
Our investment magnitude and growth figures are likely an underestimate, as the subcategory only includes dark kitchen “specialist” start-ups, such as UK-based Karma Kitchen, which raised about £250 million in 2020, or US-based CloudKitchens, which was valued at around £13 billion at the time of writing. In addition, established food delivery companies like Deliveroo have also been investing into their own dark kitchens.
The ‘kitchen tech’ subcategory has grown at a more modest rate of 81% between 2017 and 2021, with about £289 million investment per year. This subcategory includes, for example, kitchen robotics companies such as YPC Technologies, which claim their robots can make thousands of recipes using fresh ingredients and increase labour productivity four times, as well as UK-based Karakuri and domestic kitchen robot developer Moley Robotics. In addition to robotics, this subcategory also includes smart appliances like a “beverage printer” for making highly customised drinks, and software apps for home cooks and professional kitchens.
However, before the kitchen technologies are adopted at scale, they will need to survive the sharp market downturn in venture capital investment. Already, there are reports of shutdowns, including at least three pizza robotics start-ups in 2022; entrepreneurs have blamed an immature start-up ecosystem for hardware start-ups as well as a mistrust of robotics by the general public. A salad-making start-up, Chowbotics, was also shut down a year after being acquired by the food delivery company DoorDash.
Alternative protein leading the second food tech wave
Our analysis showed that the subcategory of ‘alternative protein’ start-ups were among the highest-growth areas for food innovation in 2017-2021. Emerging cultivated ‘lab meat’ start-ups (such as Future Meat, based in Israel, and US-based GOOD Meat) are leading with more than 4900% growth and £181 million yearly average investment between 2017 and 2021. These are followed by companies using fermentation to produce protein (3160% growth and £385 million), which includes, for example, UK-based mycoprotein producer ENOUGH. Plant-based protein start-ups, such as the US-based Impossible Foods are more established with slower (albeit still impressive) 610% growth and £892 million average yearly investment.
We have also distinguished a subcategory for emerging start-ups focussed on insect protein for human consumption (see Figure 14 below). This is, however, a much smaller area as most of the insect protein development is focussed on animal feed and aquaculture use cases, applications which are out of scope for this report.
Taken together, we estimate that all alternative protein investments combined have grown by about 800% between 2017 and 2021, at approximately £1.54 billion per year on average. Some have been calling this the second wave of food tech investment, following the first wave of investment into the field of delivery and logistics. In terms of more recent trends, however, we estimate that venture funding for this innovation area has decreased by about a half in 2022 compared to 2021 (51% decrease) in line with the overall decline in venture funding. Interestingly, the investment into the ‘lab meat’ subcategory appears to have been more resilient – with a 10% increase from 2021.
While alternative proteins have received considerable amounts of investment in the previous market cycle, there are indications that the early enthusiasm of consumers might have peaked and there will be lower growth and more consolidation in 2023. Moreover, it is still a nascent area in terms of market penetration. According to a report published by Boston Consulting Group, about 13 metric tonnes of alternative protein were consumed globally in 2020, which corresponds to about 2% of the animal protein market.
It is also important to note that the different types of alternative protein have different levels of maturity. Plant-based meat alternatives are now widely available and might soon reach price parity with animal proteins. For example, a US-based start-up recently announced a novel production system which they claimed reduced the production costs of plant-based nuggets by 95%, bringing them on par with their chicken counterparts. Micro-organism based proteins such as mycoprotein is also forecasted by Boston Consulting Group to reach price parity already by 2025. When it comes to cultured ‘lab meat’, however, there are concerns as to whether the complexity of the production process will ever allow it to scale sufficiently well to challenge the animal protein industry.
Nevertheless, the wider drivers underpinning the alternative protein are unlikely to diminish in future. A recent report produced by the University of Cambridge identified food security considerations, concerns about meat-related health outcomes, and sustainability as key factors behind the growth in this area. Meat production generally contributes significantly higher greenhouse gas emissions compared to plant-based protein sources – a kilogram of beef emits about 60 times more emissions compared to a kilogram of peas.
Consumer preferences have also been shifting away from meat, as daily meat consumption has decreased by 17% in the UK over the last decade. Interestingly, a recent report found that 60% of UK consumers started eating plant-based meat alternatives because they are considered “healthier”, followed by 53% who considered it “better for the planet”.
However, the health benefits for consumers are not clear cut. One study in 2021 found that plant-based burgers have fewer calories, less saturated fat and more fibre (but higher salt content) than their beef counterparts. The report produced by the University of Cambridge, however, points out that many of the alternative protein products are extensively processed – a risk factor for cardiovascular disease – and it may require 20 years of further studies before the health implications are fully understood. Future growth is far from assured if consumers’ expectations of health benefits are not met.
Emerging reformulation start-ups
Within the ‘innovative food’ category, we also identified an interesting subset of start-ups that we classed as “reformulation generalists”. In contrast to alternative protein producers, these reformulation start-ups are not necessarily specialising in one particular type of product and instead provide services or ingredients relevant to a wide range of products.
For example, Singapore-based Hoow Foods has taken inspiration from product development in the pharmaceutical industry, and uses machine learning algorithms to design healthier food formulations. Other companies focus on novel ingredients, such as US-based Epogee, which developed EPG fat, an alternative fat with 92% less calories for use in confections, spreads and other products (see also Chapter 3), or UK-based Supplant, which produces healthier sugars from fibre.
The ‘reformulation’ subcategory is categorised as ‘emerging’ given the modest amount of investment raised so far (about £70 million investment per year), combined with a high growth rate of almost 2400% (see Figure 15 below). We find this to be an encouraging signal, as these types of innovations could have a positive impact on health and obesity when applied at scale.
In addition to the ‘reformulation’ subcategory, we also note a broader subcategory of ‘innovative food (other)’ companies that have shown 305% growth and £608 million yearly investment between 2017 and 2021. Start-ups in this subcategory are generally associated with a particular brand or line of products. Examples include the US-based zero calorie beverage producer Zevia, which raised about £165 million, UK-based Innocent Drinks with more than £100 million of investment, and Swedish sweets producer Nick’s, which uses the previously mentioned EPG fat in their ice cream. While not all companies in this subcategory are necessarily focussed on healthier products, the overall growth in this subarea can also be seen as a positive signal of the rate of innovation in food products.
Nutrition: it’s getting personal
Venture funding for the category of innovations explicitly linked to food and health are classed as ‘emerging’ according to our trends typology. Between 2017 and 2021, start-ups related to personalised nutrition, dietary supplements, non-personalised dieting and biomedical solutions have received almost 3% of the total (early stage) food tech venture capital. This suggests that health has not yet been a major focus for food tech investors during this time span.
Among these start-ups, the ‘personalised nutrition’ subcategory appears to have grown the fastest, with estimated 552% growth, reaching about £500 million investment in 2021 (see Figure 16 below). Companies in this subcategory develop services that provide advice on how a particular individual should eat based on their genetics, metabolism, gut microbiota, and lifestyle. For example, the UK-based ZOE Health, which has raised about £35 million investment so far, provides a battery of tests including two weeks of continuous monitoring of blood glucose, blood fat, and the gut microbiome. This data is analysed and feeds into a personalised nutrition plan for users, with a premium version also including one-to-one nutritional coaching. Another prominent example is the US-based weight-loss programme Noom, which helps design a personalised diet plan and emphasises behavioural change, and mental wellness, and has raised about £475 million to date.
Other companies in the ‘personalised nutrition’ subcategory focus on supporting people with chronic conditions like diabetes, such as DayTwo, which has raised almost £70 million. DayTwo uses an at-home test kit and machine learning algorithms to predict people’s individual blood sugar responses to different foods, and hence suggest meals optimised for them. This service is presently offered as part of employer benefits or health plans rather than operating a direct-to-consumer model.
Besides personalised nutrition, we also note growing funding for start-ups focussed on biomedical solutions (see figure above). For example, the medtech start-up Apollo Endosurgery is producing weight loss balloons, which are placed in the stomach and help one feel full with less food, Valbiotis developing plant-based treatment for pre-diabetes, or Neurovalens working on a brainstem stimulation therapy for obesity. Other start-ups focus on behavioural approaches: MyHabeats has developed a habit-building app to maximise adherence to post-weight loss surgery guidelines, and artificial intelligence health coach Sweetch helps people with various chronic conditions follow treatment protocols.
This subcategory of ‘biomedical’ start-ups have raised about £80 million per year at a 162% growth rate between 2017 and 2021. This growth is occurring in parallel with the arrival of novel pharmaceuticals for weight loss, which are primarily being developed by larger corporates and hence not captured in our data on investments into start-ups. One example of these pharmaceutical interventions is the weight loss drug semaglutide, which has been shown to reduce one’s weight by 12% over one year, and is now available via the NHS.
In our engagement with experts, personalised nutrition as well as biomedical interventions emerged as having a high potential to positively impact obesity in the UK (Chapter 6). Therefore, this growth in investment can be seen as a positive signal. However, the degree of impact will depend on whether these tools and services are adopted at scale. Presently, personalised nutrition solutions are a premium product requiring a monthly subscription as well as a high degree of motivation on the part of the user. While they might work for some people, many might find it unaffordable or hard to keep up with. Moreover, these solutions do not address the underlying issues of an obesogenic food environment.
If personalised nutrition services do become more popular in the future, wider adoption could bring the costs down further. They might also get bundled with other services such as meal kits, shopping apps or health insurance plans, perhaps akin to a recent offer by a health insurer to provide users with an Apple Watch to earn ‘activity points’. Companies might also use a tiered pricing system to reach a wider market; for example, HealthifyMe offers a lower cost plan that connects customers with an artificial intelligence nutritionist, whereas their premium plans provide access to human specialists. We further discuss the potential consequences of the personalised nutrition trend in Chapter 6 as part of our foresight exercise.
Venture funding to reduce food waste
During our expert engagement, food waste reduction and redistribution surfaced as an important area of food innovation, which can reduce the risk and cost associated with buying fresh produce. Therefore, it is positive to see that investment in food packaging start-ups has grown more than twenty-fold, while other waste reduction start-ups have seen a more modest (but still impressive) 264% growth between 2017 and 2021 (see Figure 17 below).
Examples of innovations focussed specifically on food packaging include surface coatings for containers that inhibit microorganism growth and which aim to extend fruit and vegetable shelf-life by 60-80%. Another example is packaging that emits a special vapour that inhibits mould formation, thus requiring less preservatives and less refrigeration.
The closely-related ‘waste reduction’ subcategory includes, for example, a start-up which is developing sachets containing a chemical called 1-Methylcyclopropene (1-MCP), which the company claims increases shelf-life by about 40%. These sachets can be used in storage, transit or on the shelf, and they protect the fruit and vegetables from ageing by reducing production of ethylene (a natural ripening hormone). The well-funded Apeel (attracting £487 million in investment) coats the produce itself with an edible layer that protects the food and slows down the ripening process.
Another type of waste reduction start-up aims to facilitate the redistribution of surplus food, such as the UK-based OLIO and Denmark’s Too Good To Go apps, which have raised about £37 million and £58 million respectively. These services connect people or businesses who have surplus food with consumers for that food. Other companies like Winnow provide specialised software solutions to increase efficiencies at various points in the supply chain, with the aim to reduce or recycle the food waste.
Innovations for retail and restaurants
We estimate that funding for start-ups related to retail and restaurants has grown at a somewhat slower pace than most of the other categories of food innovation explored in this analysis. Nonetheless, growth between 2017 and 2021 has still been positive (see figure below) with the companies in the ‘restaurants’ subcategory raising about £794 million per year on average (125% growth) and ‘retail’ raising £591 million per year (85% growth).
Many start-ups in this group are developing software and hardware solutions aiming to streamline restaurant and retail operations. For example, cashier-free store solutions, cloud-based restaurant management and point-of-sale platforms, apps for making orders using QR codes, and tools for online marketing and managing multiple sales channels.
Some companies are leveraging advances in machine learning, like the Singapore-based Trax, which has raised more than £750 million in venture funding. This company uses computer vision algorithms to support in-store operations, such as automatically measuring the pricing and placement on the shelves of different products, for the purposes of ensuring compliance with product promotion contracts and notifying staff about empty shelves.
Overall, the growth in this area can be seen as an encouraging signal if these types of innovations also deliver improvements to productivity in catering and retail and reduce the price of healthy food. Stores, and especially restaurants, will also be impacted by the advances in other areas of innovation discussed earlier in this chapter, such as dark kitchens and kitchen robotics potentially reducing labour costs. New customer-facing technologies may also give rise to unintended consequences in terms of diets – for example, there are reports that self-serve touchscreen kiosks can alter customer behaviour and they might lead customers to order more food in fast food restaurants.
Conclusion
Analysis of global trends in venture funding for food innovation and food technology start-ups highlight that the past decade has been an exciting period of growth, although it seems clear that we are now entering into a new chapter with 2022’s market downturn. While the overall figures on venture funding are dominated by investment into the maturing ‘delivery and logistics’ start-up space (in particular, food deliveries), it is important to note that there has been growth of investment into practically all categories we examined.
The venture funding environment in 2022 was a markedly different landscape when compared to previous years. After a decade of growth fuelled by low central bank interest rates, the total venture capital investments across all sectors have been estimated to drop by 53% in the third quarter of 2022 as the US, the UK and other markets face a downturn. Our analysis shows a similar drop (-54%) of early stage investments into food technology and innovation start-ups.
This contraction of investment will likely pave the way for the consolidation of start-ups working on food technologies, as companies might shut down or get acquired by more established players. The market correction could dampen innovation in the field as start-ups might find it harder to attract new investment in the near term, and there will be a need to cut costs including research and development spending.
Are the patterns of VC investment we track steering the food sector towards a healthier future? We do find encouraging signals – such as the emergence of health-related start-ups (eg, personalised nutrition services) which now account for about 3% of the total food tech venture funding, as well as increased funding for start-ups specialising in healthier food reformulation technologies.
The most significant investment and growth, however, has occurred in areas that prompted concern from the experts we engaged with (see Chapter 6). The large volume of investment into food delivery and meal kit businesses might, in theory, improve food environments by reducing food deserts. However, given the indications that food purchased from restaurants, fast-food outlets and takeaways is usually associated with higher calorie intakes, it will be important to consider interventions and further innovation to ensure the impact on health is not negative.
Importantly, at present many of the services, from food deliveries, to innovative foods, to personalised nutrition come at a premium price. This necessitates further development to make them more accessible for people with lower income.
Taken together, our findings suggest that there is a case to incentivise businesses towards investing in development of innovations which are healthier and more affordable, an approach which is discussed in greater detail in Chapter 7 on recommendations.
Appendix: Zooming in on the UK venture funding
Throughout this chapter, we have focussed on global venture funding trends, as we expect that successful innovations and brands will eventually reach the UK market even if they are initially deployed in other countries. In this appendix section, we present results specifically for UK-based start-ups and compare them with other countries.
UK venture capital investment trends
We find that early stage venture funding for UK-based companies has increased about fourteen-fold in the past decade, from £56.5 million in 2011 to £828 million in 2021 (see Figure 19 below). While impressive, this growth is slower than the baseline increase of the total venture funding across all sectors in the UK during the same time period, which we estimate to have grown about 21 times.
Interestingly, this is in contrast with the global trends discussed above, where investment for food innovations were stronger than the baseline growth in investment. This supports the observation that investment into UK-based start-ups over the past decade has been primarily focussed on other sectors such as, for example, fintech, health, or energy. Interestingly, the decrease in investment from 2021 to 2022 has been smaller for UK start-ups (-24%) compared to the global food tech venture funding decrease (-54%) discussed earlier in the chapter.
In terms of investment into different categories of food innovation, we find that ‘delivery and logistics’ leads by a wide margin (£337 million per year on average between 2017 and 2021) followed by ‘innovative food’ (approximately £80.4 million each), ‘agritech’ (£71.5 million), ‘cooking and kitchen’ (£57.6 million) and health-related start-ups (£54.8 million). Meanwhile, ‘retail and restaurants’ (£28.2 million) and ‘food waste’ (£18.9 million) have received comparatively lower levels of investment (see Figure 20).
This distribution of investment appears somewhat more balanced compared to the global distribution. While it is still dominated by start-ups related to food delivery and logistics, their fraction of the total investment is slightly smaller (54% of the UK venture funding, compared to 60% globally). Meanwhile, agritech, innovative food, cooking and kitchen, and health-related start-ups have all received comparable amounts of investment.
Among the UK-based companies that have raised the most investment, we find food delivery platforms Deliveroo (approximately £1.2 billion in total early stage investments), Zapp (£219 million), and HungryPanda (£165 million), as well as the meal kit company Gousto (£233 million).
Glasgow’s ENOUGH, Leeds-based Meatless Farm, and London-based THIS are prominent examples of alternative protein start-ups raising between £20 million and £40 million. In terms of UK-based reformulation specialist start-ups, we identified Scotland-based Nandi Proteins (£2 million), Cambridge-based Supplant (£24 million), and Stem.
London-based dark kitchen start-up Karma Kitchen also stands out with about £250 million of venture capital investment. The ‘cooking and kitchen’ innovation category has been bolstered also by investments into kitchen robotics start-ups Karakuri and Moley Robotics and kitchen software developers Winnow, resulting in more than fifteen-fold growth in funding between 2017 and 2021 (see Figure 21 below).
Other high growth areas include ‘agritech’ (585%), ‘food waste’ (317%) and ‘innovative food’ (265%). These are followed by ‘delivery and logistics’ (69%), which show a positive, albeit slower than baseline, growth. Meanwhile, health-related start-ups (-6%) and ‘retail and restaurants’ (-18%) have a slightly negative growth rate.
International comparison
When comparing the total early-stage venture funding between 2017 and 2021 across countries, the UK ranks in sixth place, following the United States, which dominates with £41 billion in total investment, China, India, Singapore and Germany (see Figure 22 below). For reference, the combined investment across all European Union countries is about £11 billion, which would place it in third place, following the US and China.
In terms of relative growth across the five-year time period between 2017 and 2021, UK venture funding has been growing faster (109% growth) compared to the US (59% growth), China (13% decrease), Singapore (17% growth), and Germany (40% growth). This suggests that venture funding in the UK is growing faster compared to most other countries with similar or higher levels of investment. It will be interesting to see if this momentum will be sustained through the market correction in the coming year.
Meanwhile, India has experienced 341% growth paired with a relatively high magnitude of investment, suggesting that the venture funding for food innovations in the country is 'hot' according to our trends typology. Other countries with high growth (but lower levels of investment) include Colombia, France, and the Netherlands (see Figure 23 below).
Looking into the different innovation areas, we find that the United States is leading across all categories by a wide margin, followed by a slightly different mix of countries for each category. The UK is among the top five countries in terms of total early-stage funding for ‘cooking and kitchen’, ‘food waste’, ‘health’, and ‘innovative food’ categories (see Figure 24 below). The UK is also among the top ten countries for the ‘delivery and logistics’, ‘restaurants and retail’, and ‘agritech’ innovation categories.
We note that the UK ranks second for health-related funding, with the main contributions coming from investments into the previously highlighted ZOE Health and Neurovalens start-ups, as well as an e-commerce retail company The Hut Group. We included The Hut Group in the ‘health’ category as it offers nutrition and dietary supplement products, though it is a large company with a diverse set of business areas including beauty and luxury goods, and hence not all investment is health-related.
The UK has a comparatively low ranking of seventh in the ‘delivery and logistics’ category. However, this is due to most of the UK delivery and logistics venture funding being associated with later stage deals (eg, IPOs, mergers, and post-IPO investments). These deals involve more established companies, such as Just Eat’s multi-billion merger with Takeaway.com and about £1.7 billion late stage investments into Deliveroo.
When we compare countries in terms of the overall investment raised through late stage deals in the five-year period between 2017 and 2021, the UK ranks in second place after the US (see Figure 25 below). This is largely due to a handful of companies, namely food delivery platforms Deliveroo and Just Eat, as well as the (partly health-related) e-commerce company The Hut Group. These three companies contribute more than 90% of the total amount of late stage UK investments between 2017 and 2021.
Important information
This report is not an investment recommendation or financial promotion, and should not be relied upon as such; it is an experimental analysis of venture capital investment, research funding, patent and public discourse data, focused on companies and research projects aligned to Nesta’s healthy life mission. The companies named within this report are cited purely as examples, helping demonstrate the analysis approach. Their inclusion should not be interpreted as an endorsement or indication of investment-worthiness by Nesta.
Methodology
In our analysis, we used data from Dealroom global company information database, which provides an extensive coverage of food technology start-ups (data last accessed in November 2022).
To categorise trends around different food innovation categories, we adapted and adjusted Dealroom’s segmentation of the food tech start-up landscape. First, we manually matched the company industry labels and tags used in Dealroom to the categories and subcategories of our innovation landscape presented in Chapter 1. We then used each company’s industry labels and tags to automatically assign them to one or more categories in our taxonomy. We manually reviewed these automatic assignments and corrected them where required. We also excluded companies that were tagged as being related to pets and pet food.
In summary, we assigned 5,785 companies to seven broad innovation categories and 21 narrower categories. In this, we prioritised companies that had raised at least a single investment round: companies that had not raised investment would not influence our analysis. While we aimed to minimise overlaps between innovation categories, a single company can occasionally be assigned to multiple innovation categories. In such cases, we have taken care to avoid double counting when reporting aggregated investment figures. The final list of companies included in the analysis can be found here.
We have distinguished between early and late stage deals, which are usually associated with start-ups and more mature companies respectively. Among the early stage deals, we have included angel, seed, series A to series I, early VC, late VC, growth equity, convertible, media for equity, project, real estate and infrastructure finance, secondary, private placement VC, and spinout investments. Late stage deal types include acquisitions, mergers, buyouts, debts, lending capital, IPO, post-IPO investments, and SPAC IPO. More information about the different types of deals can be found on Dealroom’s website.
To estimate baseline funding growth for early stage investments across all sectors, we accessed data from Crunchbase business intelligence database, taking care to include only deal types equivalent to the Dealroom early stage investments in the baseline calculation.
Note that in our analyses, we have taken a medium-term view by focusing on trends over a five-year time period between 2017 and 2021. Throughout the chapter, we report a smoothed estimate of investment growth that compares the rolling three-year average of investment in 2017 versus 2021. More precisely, it is the comparison between the average across 2015-2017, and the average across 2019-2021. In this way, we aim to characterise the medium-term growth and smoothen the year-to-year fluctuations.
At the time of writing this report, our datasets did not have a complete coverage of 2022, and hence we refrained from incorporating it into the trends figures as it might skew our analysis. Nonetheless, where salient we do make reference to developments in 2022 in order to acknowledge how the very latest trends might affect the market in future.
For the purposes of visual clarity, time series of yearly research funding between 2010 and 2021 are plotted using the monotone interpolation method, which preserves the precise values of the underlying (yearly) data points.
The analysis code can be found in the project’s GitHub repository.
Acknowledgments
We thank Jack Rasala for his contributions to the venture capital analysis code.